Lesson 2.3.
How to Do a Content Health Check-up for Your Account
Are you posting too much on your social media pages but not getting much engagement? Is your content of a higher quality than your competitors' posts? Is your timing perfect to catch the eye of your followers?
- Check your Posting Density effectiveness.
- Analyze the Content Performance and check for ignored posts.
- Best/worst posts analysis.
- Types of Content analysis.
- Best Time to Post analysis.
- Content Segmentation.
1.Check your Posting Density effectiveness.
Compare your posting density effectiveness with Competitors’ or other brands of your company with the help of Posting Density Matrix.
Example:
Here’s the results we have after analyzing top 5 luxury brands on Facebook:
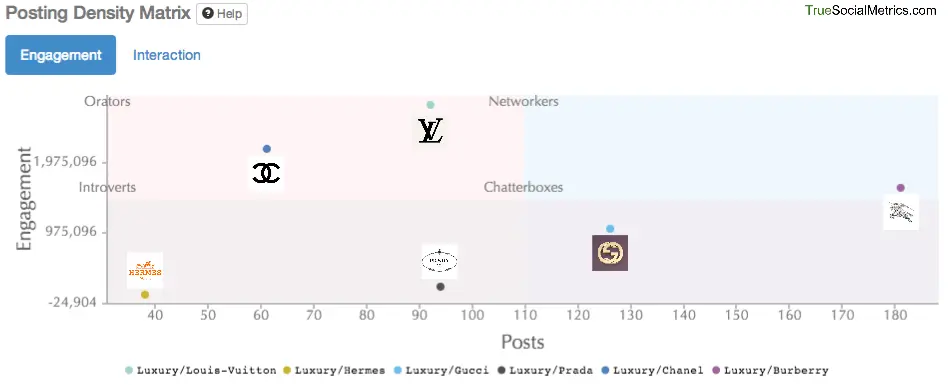
*Engagement = (Likes+Shares+Comments), (for selected time range)
*Posts = Number of Posts, (for selected time range)
Performed with Posting Density Matrix report
Good job, Burberry. And even better job, Chanel and Louis Vuitton - they are true orators. Posting 3 and 2 times less than Burberry they managed to get 30% and 70% higher Engagement respectively. Which means they are spending less resources on content creation but are still getting more attention.
Takeaways:- Chanel and Louis Vuitton have the most effective content strategy - posting less than other luxury brands they spend less resources on content creation but still have great feedback from followers. And are great at reaching the target audience - despite not having the biggest number of followers they are still able to engage them better than other brands.
- Burberry has a relatively good posting strategy and potential reach (number of followers), but still has space to improve, maybe by benchmarking some good ideas from Chanel and Louis Vuitton.
- Gucci has to conduct an audit of their Facebook strategy to find the main directions for improvement: adjust their content strategy /time to post/ followers’ acquisition strategy.
- Prada and Hermes need to make their presence on Facebook stronger.
Read the full case study: Luxury brands on Facebook: Analyzing best and worst content, or why Prada fans hate suits
Demonstrating the Competitive analysis performed with the help of Engagement matrix, Posting density matrix and Best/worst posts report. Analyzing and comparing the Quality of the Followers, Posting Density and top Best / Worst ideas for posts.
2. Analyze Content Performance and check for the ignored posts.
Find out how many posts with no engagement do you have in comparison to other brands and Industry Average with the help of the Content performance report.
Example:
By analyzing the Facebook accounts of the DoubleTree hotel chain in Europe we have found an average percentage of posts without Shares, Comments and Likes for this brand. This could be used as an Internal Company Standard for unengaging Facebook posts, deviation from witch should be monitored for each individual hotel:
- 76% of posts have no Comments;
- 84% of posts have no Shares;
- 7% of posts have no Likes.
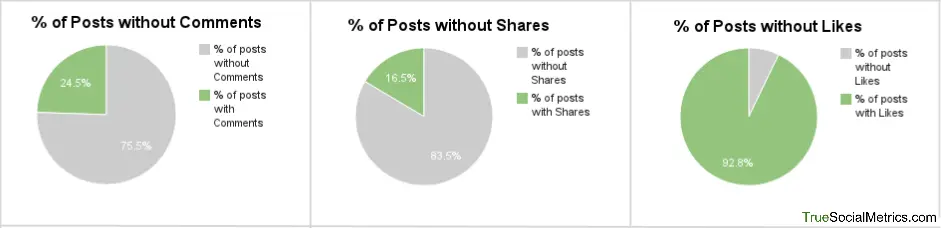
Data from Content Performance report
For easy comparison we can also analyze the % of posts without any engagement (no comments, shares and likes) compared to competitors or other brands/branches of your company:
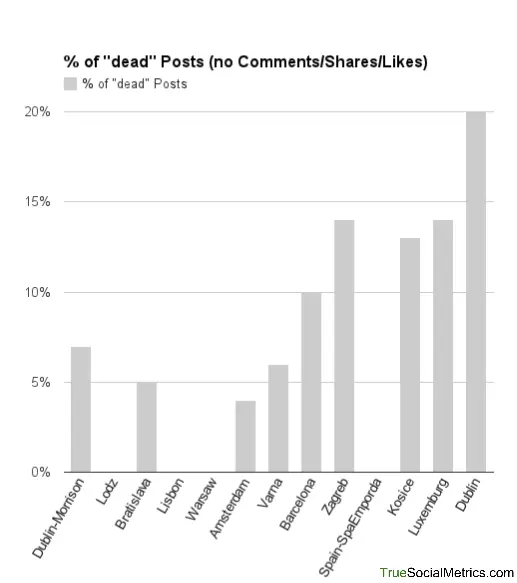
Data from Content Performance report
In this case, we have found a clear correlation between brands’ performance on Facebook and the percentage of "ignored posts” it has. The next step would be to analyze the content and posting time of the “ignored posts” to find out why they don’t provoke any reaction from users.
Read the full case study:
DoubleTree Hotels on Facebook: Benchmarking from fellow-brands
Featuring the Competitive Analysis performed with the help of the Competitors Sets, which helped to analyze the brand in 3 different contexts and create 3 different standards to compare with and 3 sources for benchmarking effective content tactics: competitors, sister-brands, and fellow-brands from the same hotel chain.
3. Best/worst posts analysis.
Find insights and inspiration how to improve your content. Use the Best/worst posts Competitive analysis report to analyze the top performing content and the least effective posts.
Example:
Let’s take a closer look at each one of the top 5 luxury brands by analyzing their top 10 best and worst posts on Facebook.
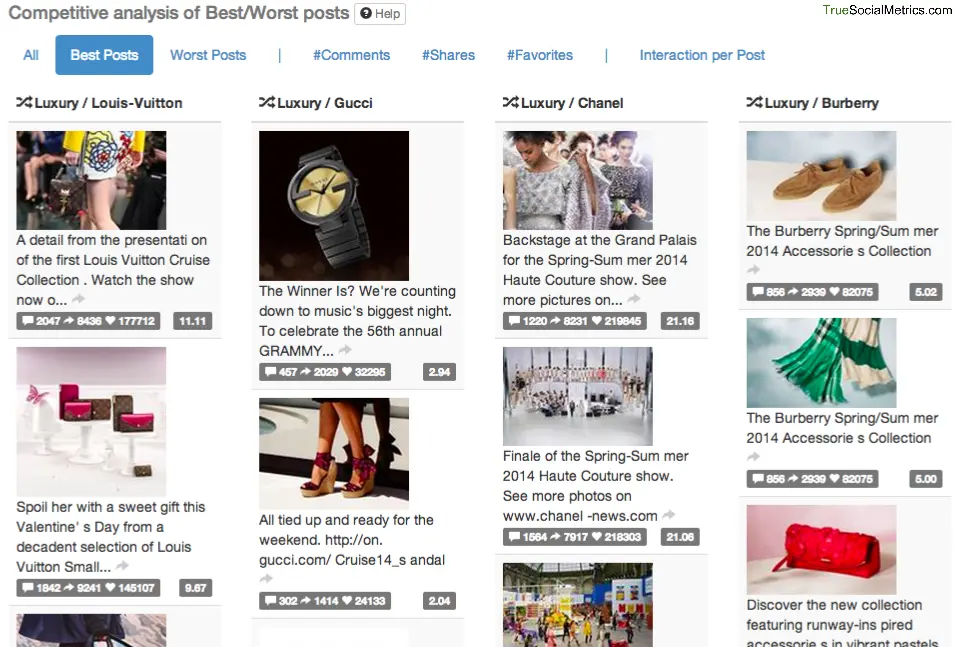
Performed with Best/Worst posts report
We have tried to categorize the topics for best and worst post for each brand like that:
Prada
Best posts: 4 out 10 best posts are celebrities wearing Prada (women celebrities, mostly). And 3 posts are photos of the products.
Worst posts: Men in Prada. No, really; 6 out of 10 worst posts are featuring celebrity men wearing Prada. Why?
Reason #1: Bad fit.

Reason #2: 78% of users who engage with Prada’s Facebook page are women:
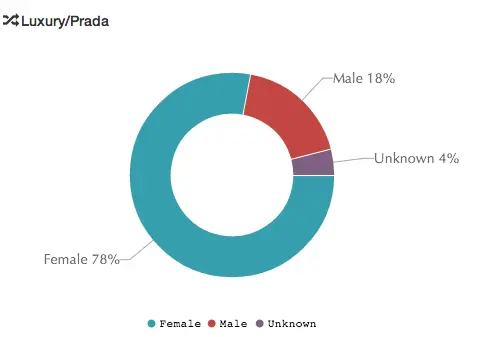
Performed with Audience report
We did the same kind of analysis for each of 5 brands. And based on the results of analysis, here’s what the distribution of worst and best topics for Facebook posts of luxury brands looks like:
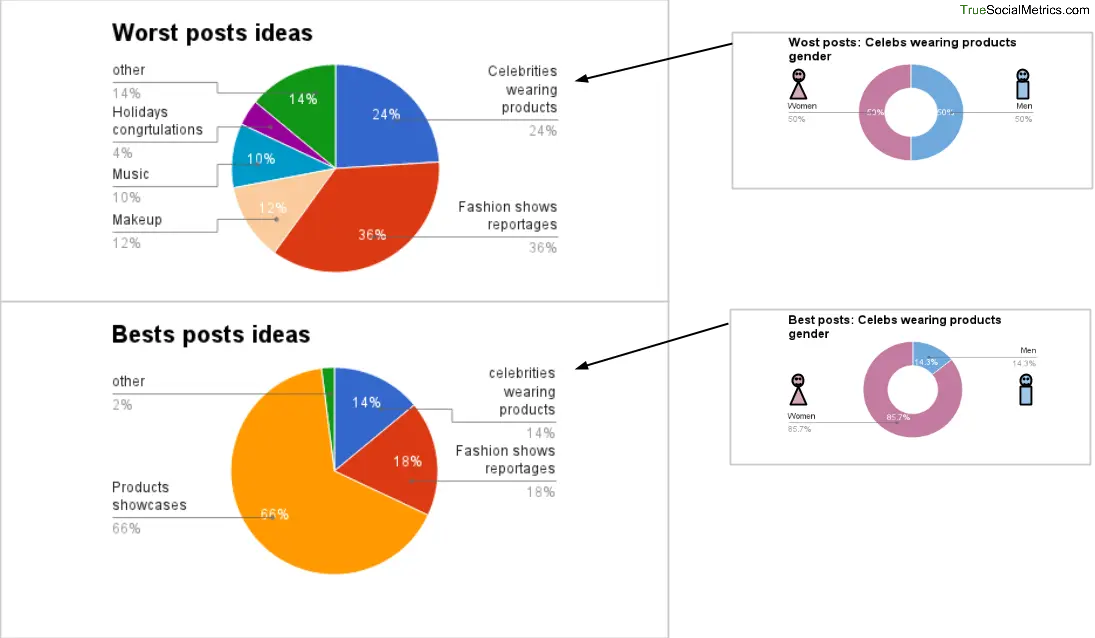
Notice that it’s hard to find product photos and videos among the worst posts. While reports from fashion shows and photos of male celebrities are riskier topics with a higher probability of falling into the low performing posts basket.
Takeaways:- Be careful with photos of celebrities wearing your clothes. Unlike photos with professional models, the clothes may not always suit and fit celebrities perfectly (well, they can afford it - they are famous anyway :) ). On top of that, the celebrity may not always be associated with your brand by fans.
- No wonder that product showcases tend to work the best; both in photo and video format. After all, that’s why these Facebook pages were created - to advertise products.
Read the full case study: Luxury brands on Facebook: Analyzing best and worst content, or why Prada fans hate suits
Demonstrating the Competitive analysis performed with the help of Engagement matrix, Posting density matrix and Best/worst posts report. Analyzing and comparing the Quality of the Followers, Posting Density and top Best / Worst ideas for posts.
4. Types of content analysis.
Use the Types of Content report to reveal the most and least effective media type: is it photos, videos, links or plain text posts.
Example:
By analyzing top 5 luxury brand’s best and worst posts on Facebook here’s the results we have found:
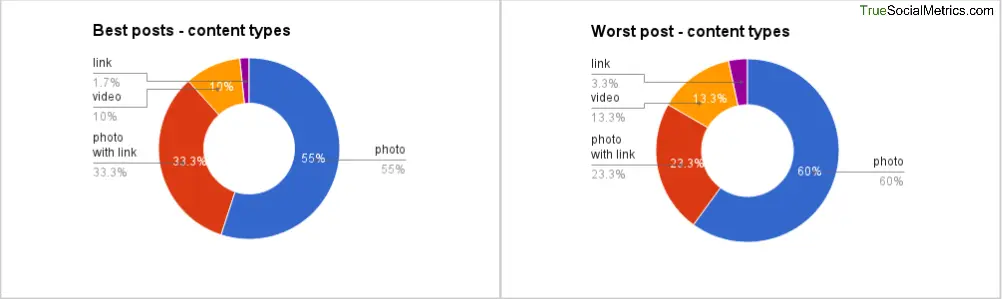
Data from Types of Content report
No, it is not a copy-paste mistake, it’s two different graphs, they just look like twins. In this case, it appears, that the type of content is not as important as the message itself. Maybe for different type of brands, industry or social networks these picture could be different, however, for the luxury brands on Facebook the distribution of the worst and best performing types of media looks identical.
Read the full case study: Luxury brands on Facebook: Analyzing best and worst content, or why Prada fans hate suits
Demonstrating the Competitive analysis performed with the help of Engagement matrix, Posting density matrix and Best/worst posts report. Analyzing and comparing the Quality of the Followers, Posting Density and top Best / Worst ideas for posts.
5. Best time to post analysis.
With the help of Best Time to Post report find out if you are missing out the sweet spot for the most engaging time to post. Compare your Current posting time with the suggested most effective time to post.
Example:
In this example we analyze DoubleTree Amsterdam hotel best time to post on Facebook. Switch to “Engagement” tab to find the sweet spots to post. And analyze what your users are doing during these time frames in real life to understand situations when they consume content the most effectively:
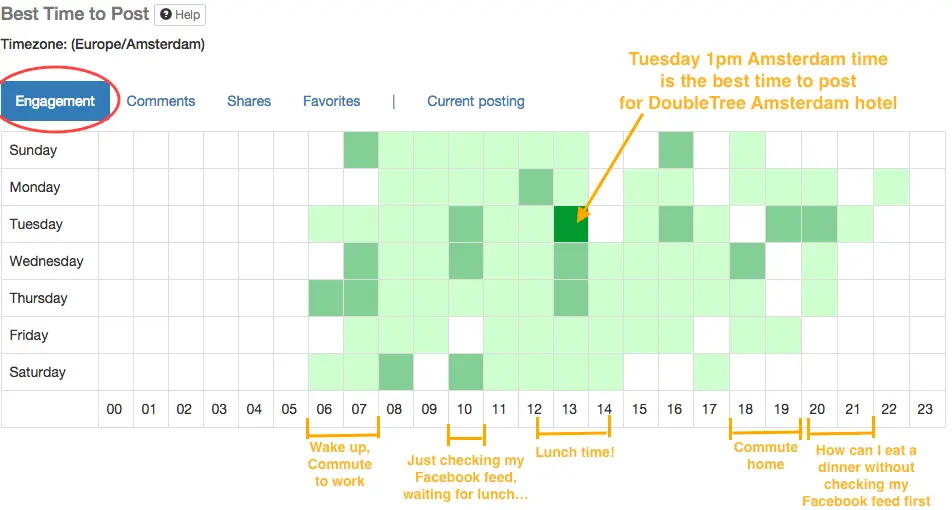
Data from Best Time to Post report
Then switch to “Current posting” tab to look at the time slots when your brand currently makes the most posts:
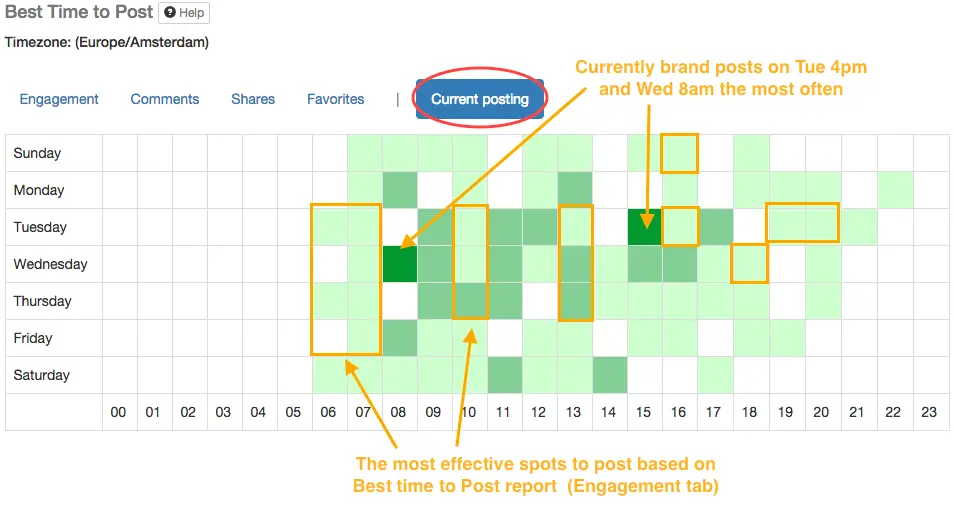
Data from Best Time to Post report
When comparing these two graphs you can see that the brand posts the most during working hours. But that is the problem, because during working hours users actually work and don’t have so much time to engage with brand’s posts.
6. Content Segmentation.
Segment your content with Custom Content Segmentation to discover your most effective content campaigns and posts topics.
Example:
Let’s perform a Twitter campaigns/hashtags analytics for Oreo. This brand has a great practice of creating mini content series and marking them with creative hashtags. We’ll analyze and compare 5 of these tiny “campaigns” and find out how effective are they.
- Oreo Cookie Balls - Christmas spirited pictures of funny shaped holiday cookie balls.
- Oreo Snack Hacks - Vine videos with funny hacks about Oreo.
- Dunk Swag - featuring wearable Oreo souvenirs.
- Oreo Deep Thoughts - funny Oreo-transformed idioms mostly with no pics.
- Oreo Fortunes - fortune telling tweets with pics.
Let’s compare these content series against each other to find the winners:
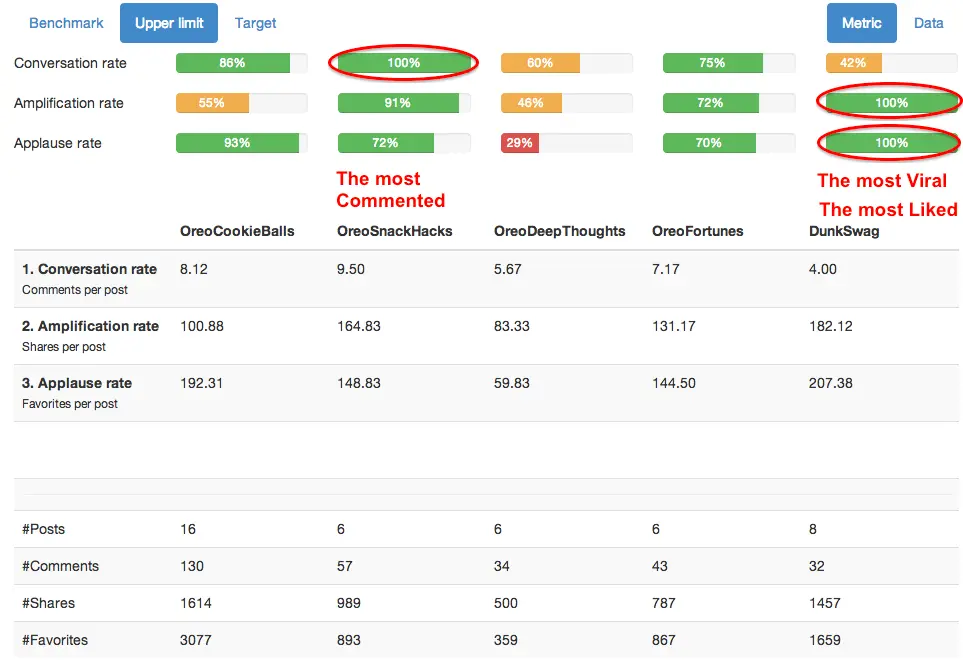
Performed with with Content Segmentation report
Oreo Snack Hacks wins the Most Commented campaign nomination - looks like creative hacks is a good conversation starter.
Dunk Swag appears to be the Most Viral and Liked series - funny pics were always a good viral-material.
Oreo Deep Thoughts turns out to be the looser campaign by all nominations. Looks like plain text tweets, even if really creative, aren’t so entertaining as awesome funny pics and vid
Read the full case study: How Oreo rocks in Twitter: using content segmentation for tweets analysis
Describing the content analysis with the help of Custom segmentation - analyzing content-campaigns, different content types (links, images, videos, plaintext), owned vs rented content performance, and comparing different content types effectiveness on several social networks.