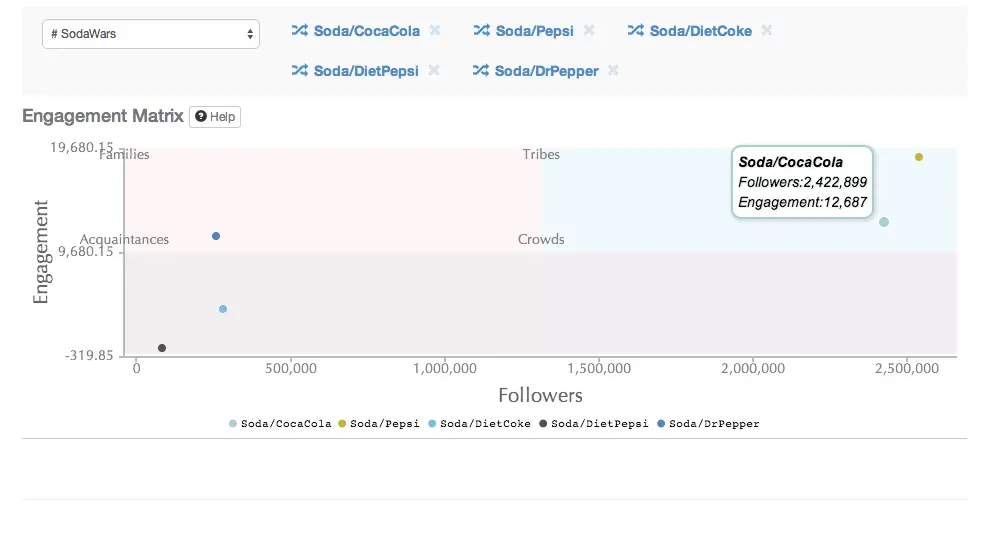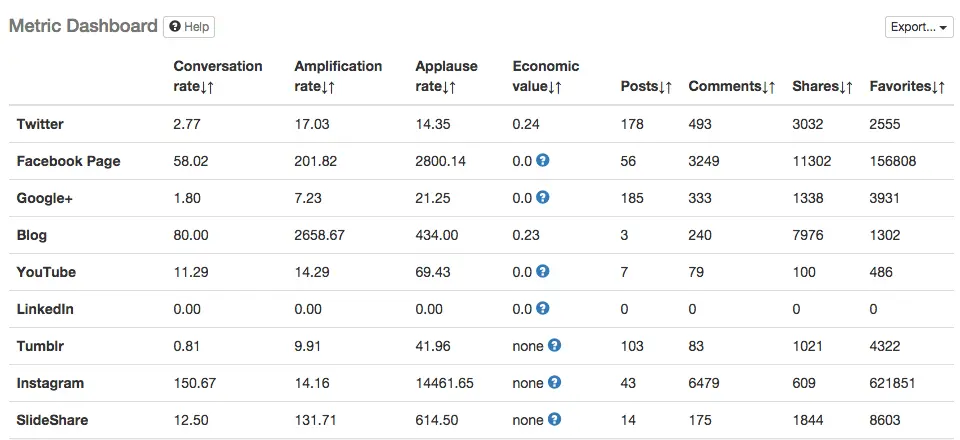
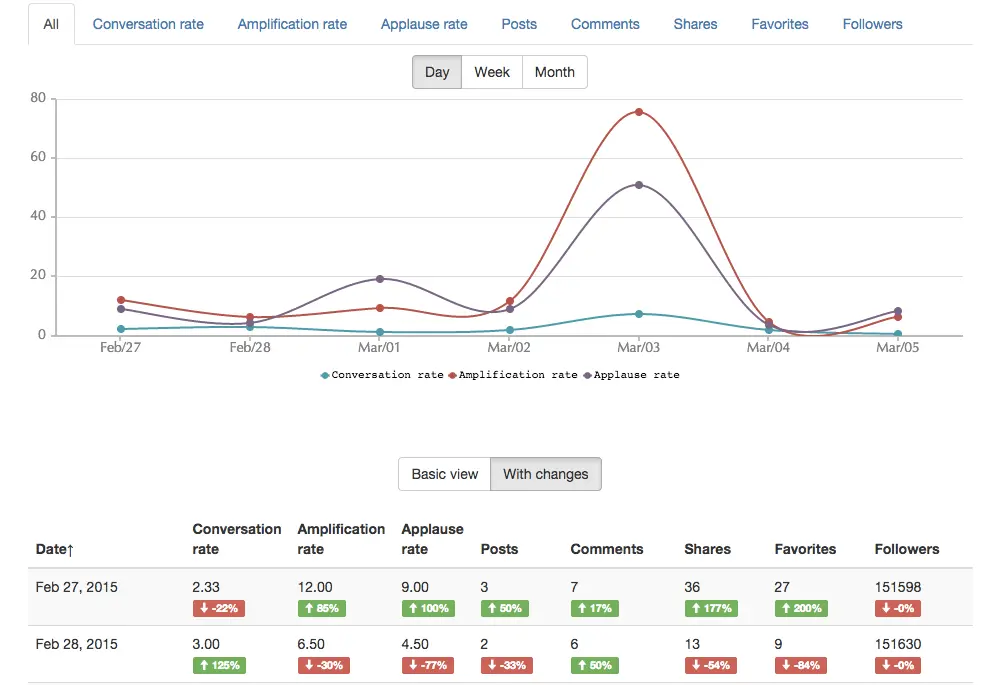
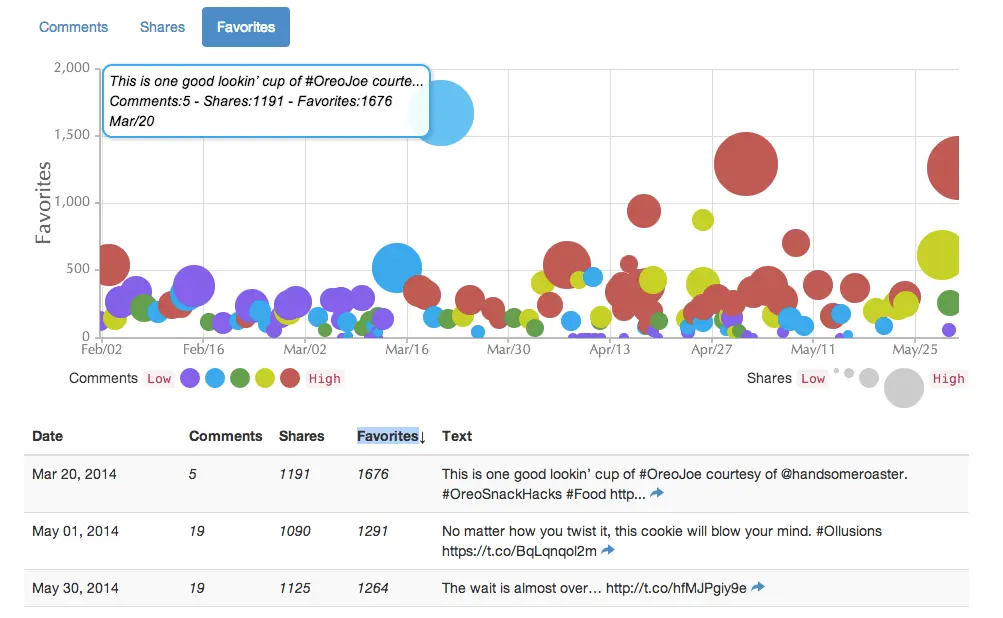
Posts Effectiveness analysis
Find out which posts are the best at engaging your followers: which are triggering a conversation, or are more likely to be shared or favorited.
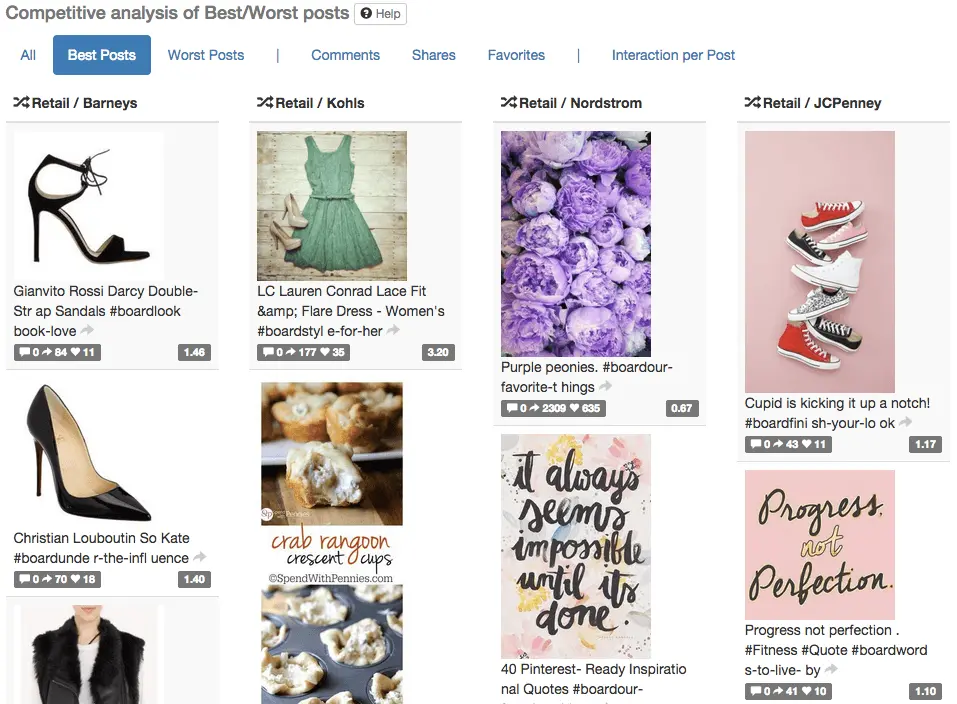
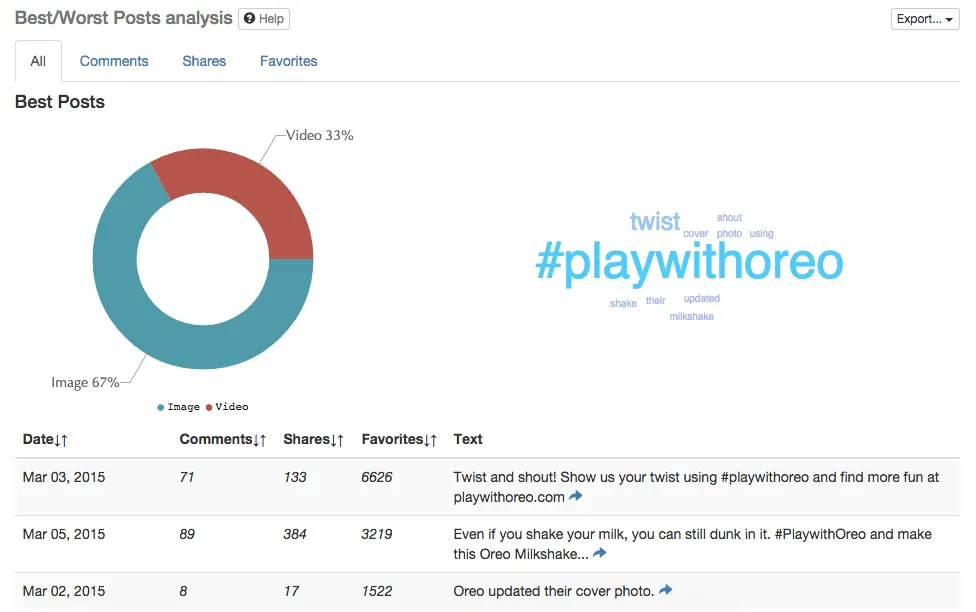
Best/Worst Posts analysis
Discover which types of content perform the best - videos, links, pictures or text. Uncover the best and the worst topics and keywords for successful posts.
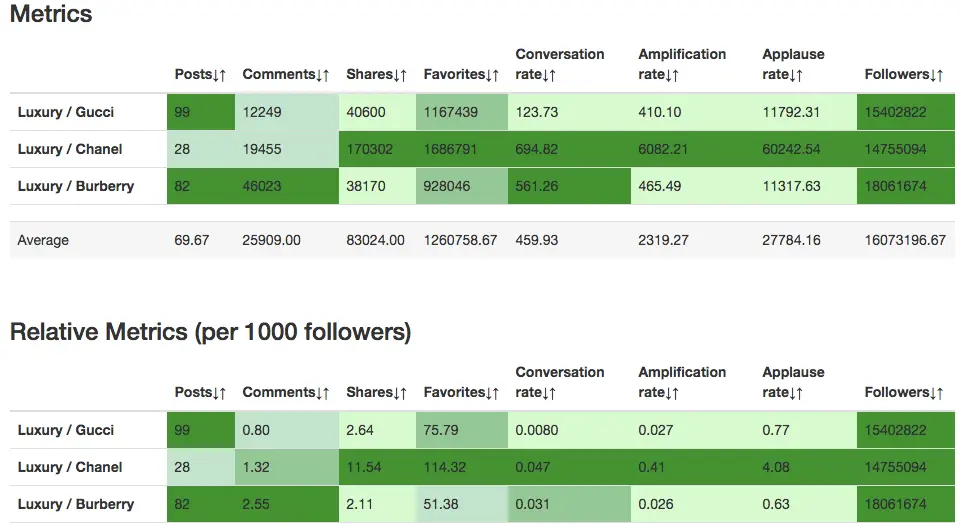
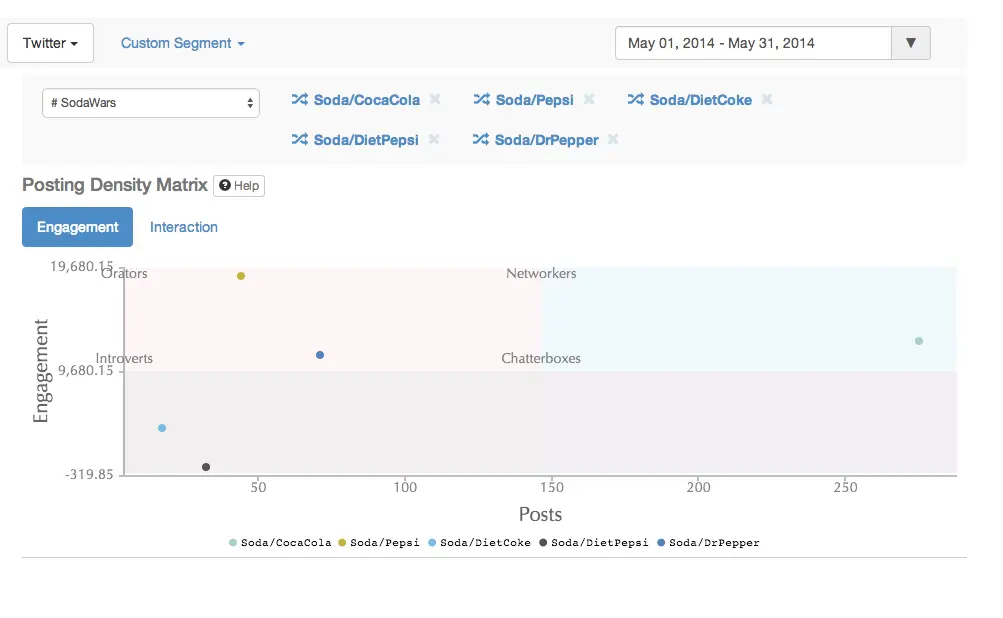
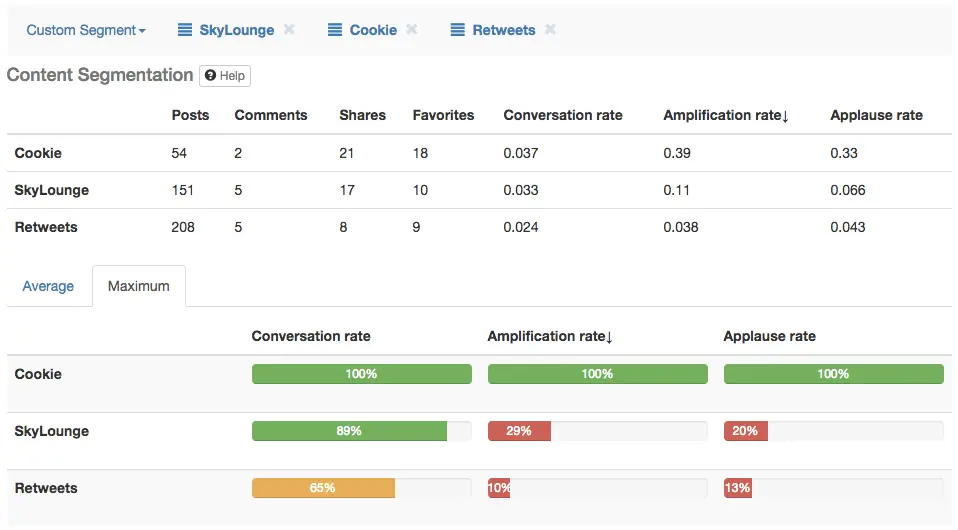
Content Segmentation
Segment your posts and compare different segments to find out which type of content is the most engaging for your followers. Are posts of a particular topic more effective than others? Was your social media campaign successful?
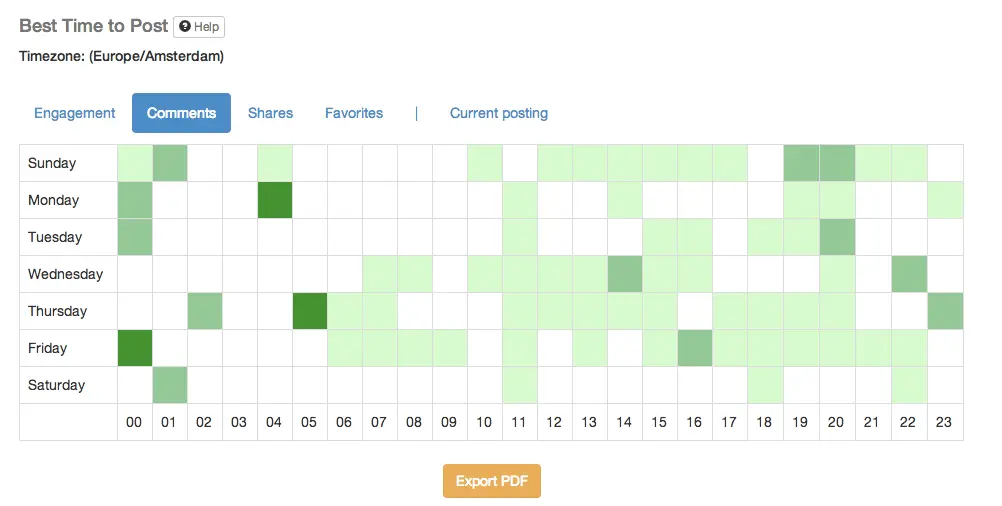
Best Time to Post
Discover the best time to post on your social media accounts, when your followers are the most active. It will increase the engagement with your account and the exposure of your posts.