Lesson 2.4.
How to Do a Competitive Analysis
- Build Competitors Lists.
- Compare the Performance.
- Compare the Content Quality.
- Compare the Followers Quality.
- Benchmark ideas.
1.Build Competitors Lists (optional).
This feature is made for your convenience. If you have quite a few brands out there use Competitors Lists to create groups of several accounts for easy comparison. Brands could be grouped in lists by different contexts:
- by geography (continental branches, capital cities branches),
- by type of a product (movies, soda brads, chocolate bars),
- type of the industry (agricalture, non-profits),
- by type of business (owned, franchised) etc.
Or grouped to be compared with different brands: - competitors lists,
- sister-brands lists,
- affiliates,
- foreign branches etc.
Example:
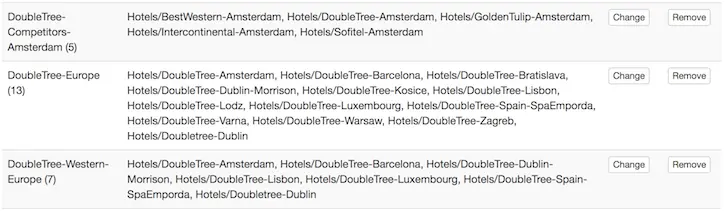
For example, we created three competitors lists for DoubleTree by Hilton Hotel in Amsterdam to analyze it in several different contexts. At the end of the day we’ll have three different standards to compare with and three sources for benchmarking: competitors, sister-hotels from Hilton group and other branches of DoubleTree hotel. Here’s the lisf of our three Competitors Lists:
- Competitor Hotels in Amsterdam.
- Other Hilton Hotels in Amsterdam.
- All DoubleTree Hotels in Western Europe.
Read the full case study: DoubleTree Hotels on Facebook: Benchmarking from fellow-brands
Featuring the Competitive Analysis performed with the help of the Competitors Sets, which helped to analyze the brand in 3 different contexts and create 3 different standards to compare with and 3 sources for benchmarking effective content tactics: competitors, sister-brands, and fellow-brands from the same hotel chain.
2. Compare the Performance.
Go to the Competitor Metrics report and select a Competitor List from the ‘Competitor List’ drop-down menu at the top left corner of the page. Or just select accounts for comparison from 'Select Competitor' drop-down menu one by one.
Use Relative Metrics report for a quick snapshot and comparison in %;
Relative Trend report for historical changes overview;
And Leaderboard report for a convenient instant comparison.
Example:
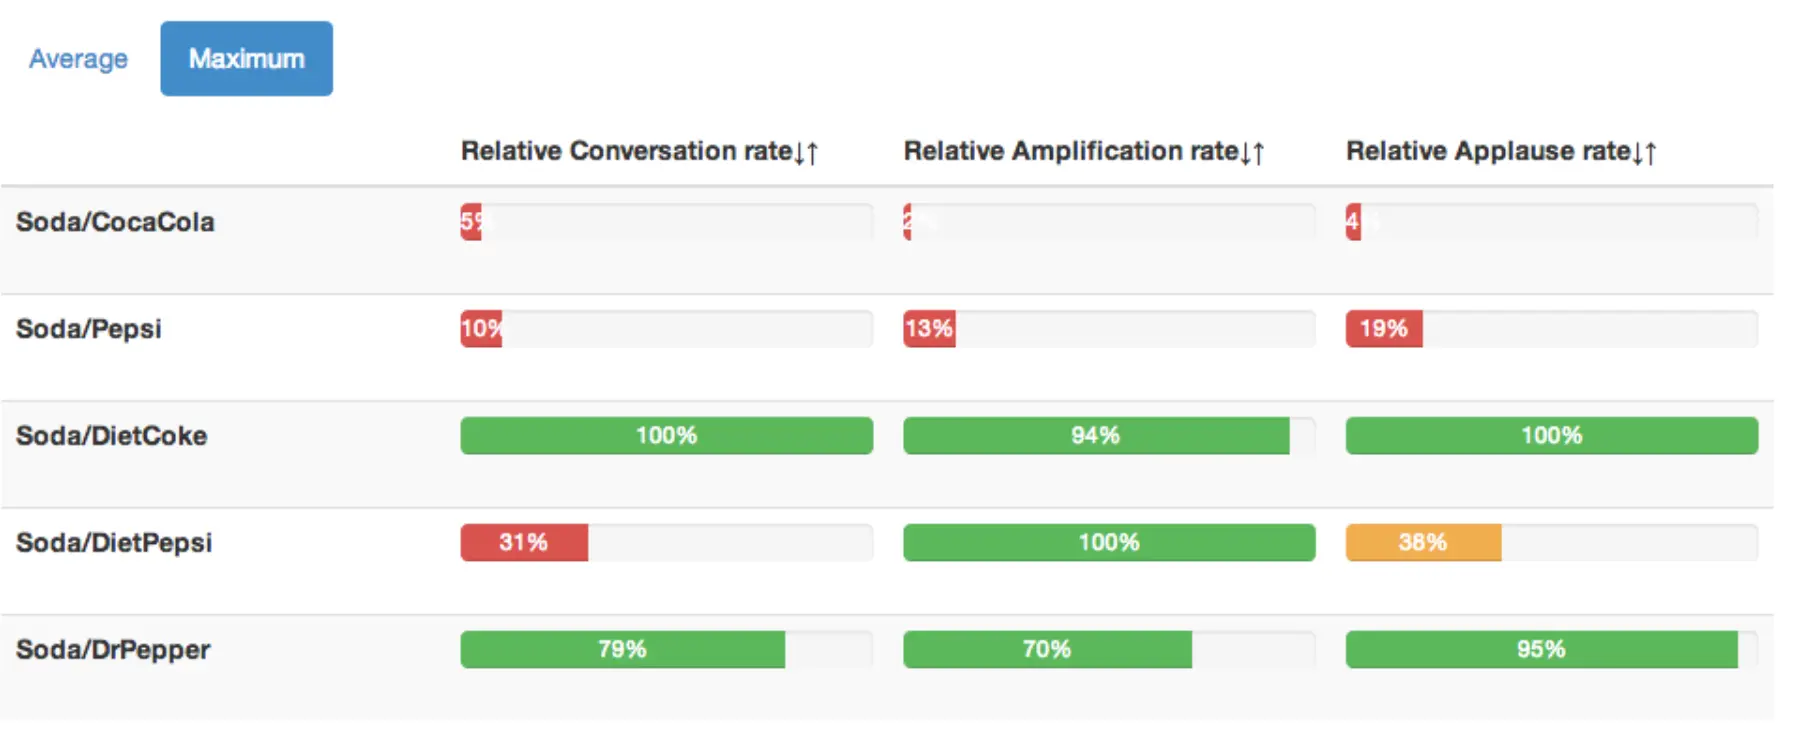
In this example we’ve compared the four hotels from Hilton group in three dimensions: Conversation rate, Amplification rate, Applause rate (Comments per post, Shares per post and Likes per post). With the maximum results marked as 100%, the graph above is showing us by how much each hotel is lagging behind the leader.
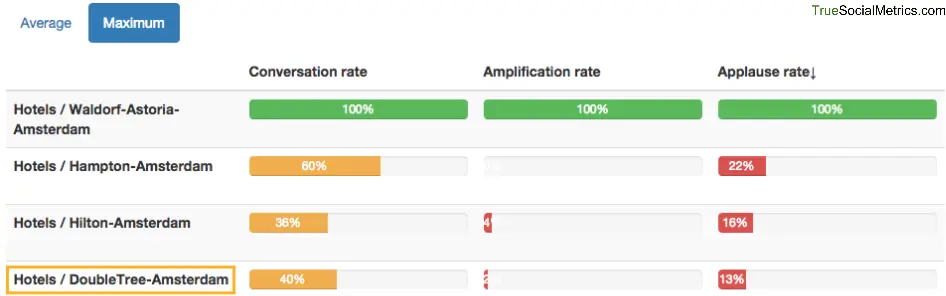
Data from Competitor Metrics report
Read the full case study: DoubleTree Hotels on Facebook: Benchmarking from fellow-brands
Featuring the Competitive Analysis performed with the help of the Competitors Sets, which helped to analyze the brand in 3 different contexts and create 3 different standards to compare with and 3 sources for benchmarking effective content tactics: competitors, sister-brands, and fellow-brands from the same hotel chain.
3. Compare the Content Quality.
Use Posting Density Matrix report to analyze the effectiveness of your Posting Density compared to competitors. Is your brand a chatterbox: Posting too much with no one listening; or a true orator: A word aptly spoken is like apples of gold.
Example:
In this example Chanel and Louis Vuitton are true orators. Posting 3 and 2 times less than Burberry they managed to get 30% and 70% higher Engagement respectively. Which means they may be spending less resources on content creation but are still getting more attention. And they are not spamming fans with lots of posts but try to find the most interesting and engaging topics.
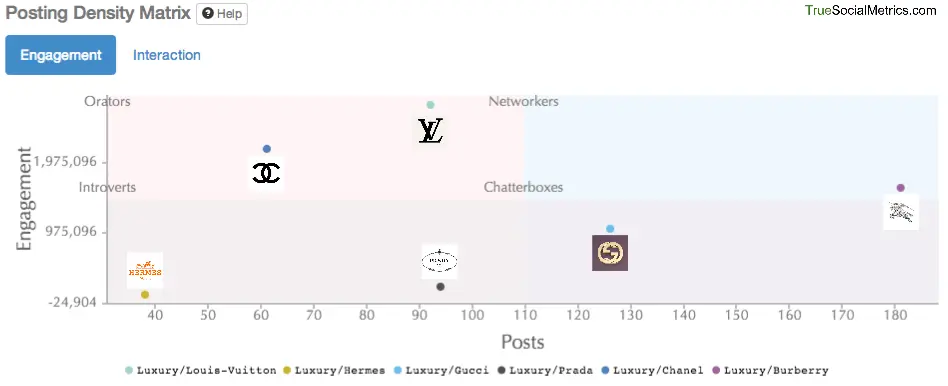
Data from Posting Density Matrix report
Read the full case study: Luxury brands on Facebook: Analyzing best and worst content, or why Prada fans hate suits
Demonstrating the Competitive analysis performed with the help of Engagement matrix, Posting density matrix and Best/worst posts report. Analyzing and comparing the Quality of the Followers, Posting Density and top Best / Worst ideas for posts.
4. Compare the Followers Quality.
Use Engagement Matrix report to find out how active are your followers compared to competitors’ fans. Are they just a small pack of inactive acquaintances or are they super engaged innumerous tribes.
Example:
In this example Burberry, Chanel, Louis Vuitton have active ‘Tribes’ of followers. While Gucci has a huge ‘Crowd’ of less active fans - with 9% more followers than Chanel has, Gucci received 50% less engagement than Chanel. Maybe Gucci should improve their content strategy by posting more engaging content, adjust their posting time according to the time when followers are the most active, or improving their followers’ acquisition strategy.
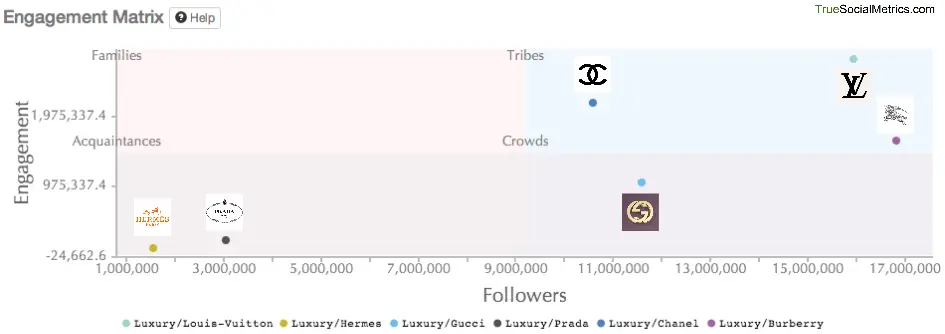
Data from Engagement Matrix report
Read the full case study: Luxury brands on Facebook: Analyzing best and worst content, or why Prada fans hate suits
Demonstrating the Competitive analysis performed with the help of Engagement matrix, Posting density matrix and Best/worst posts report. Analyzing and comparing the Quality of the Followers, Posting Density and top Best / Worst ideas for posts.
5. Benchmark ideas.
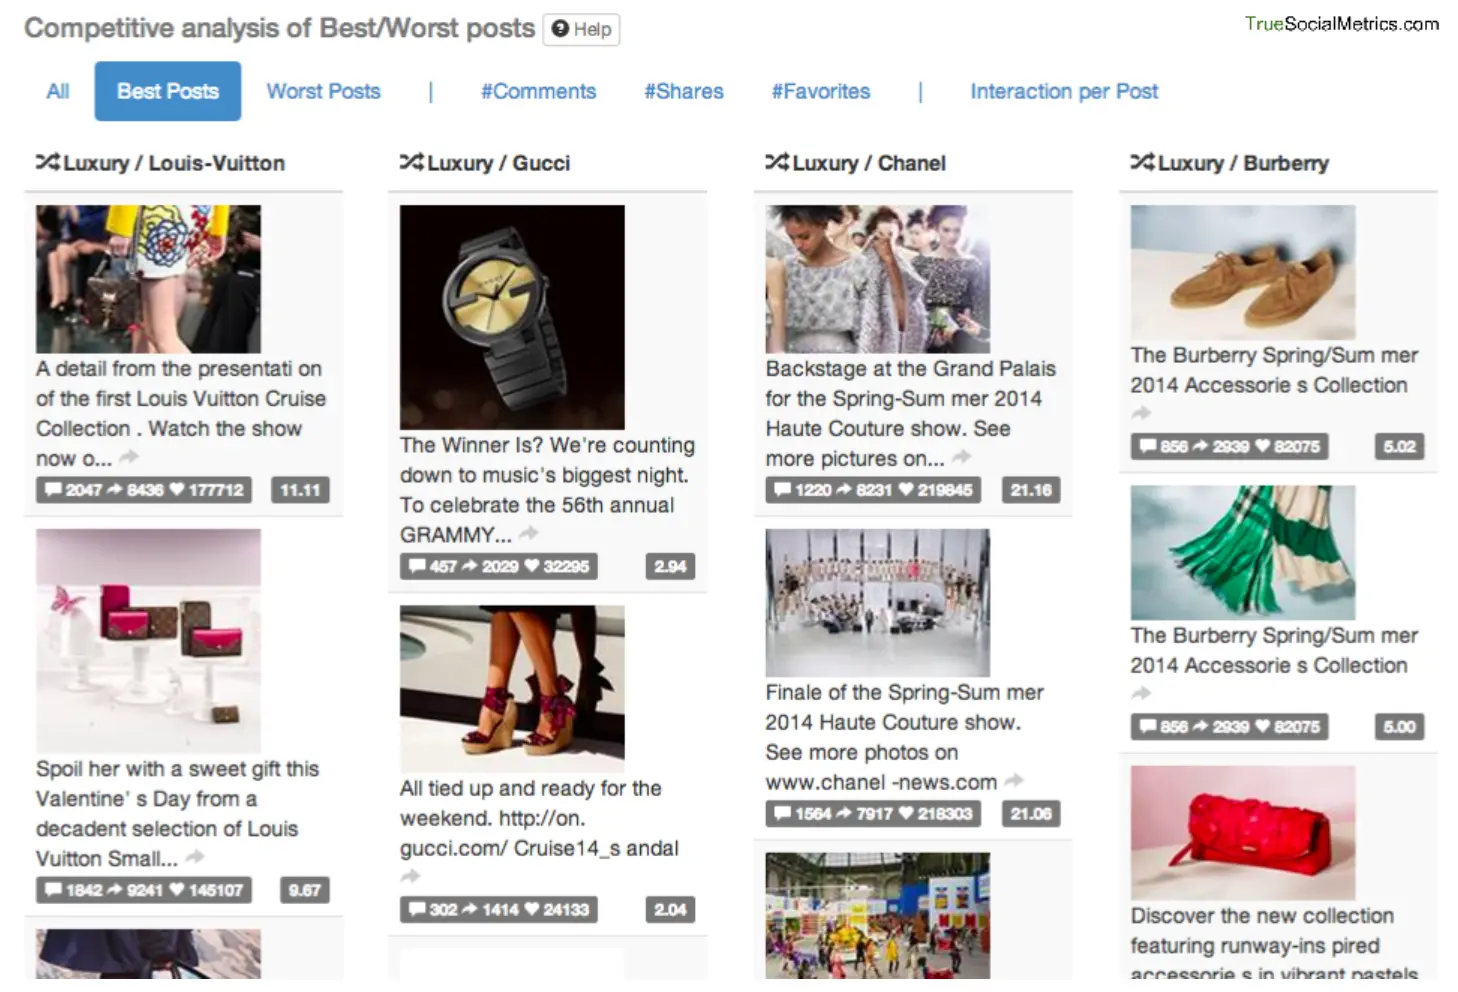
Use Competitors’ Posts report to analyze your competitors best/worst posts and compare with your own content strategy. Borrow great ideas from your rivals and get insights how to engage your followers more.
Example:
In this example we found out that using contests, even with low-budget prizes, could be an effective engaging content technique for hotels. This could also help attract new visitors to the hotel by promoting the events hosted by the hotel. Meanwhile, posting plain photos of the interior isn’t such a good practice. Making the photos more creative and adding some emotional context could save the situation.
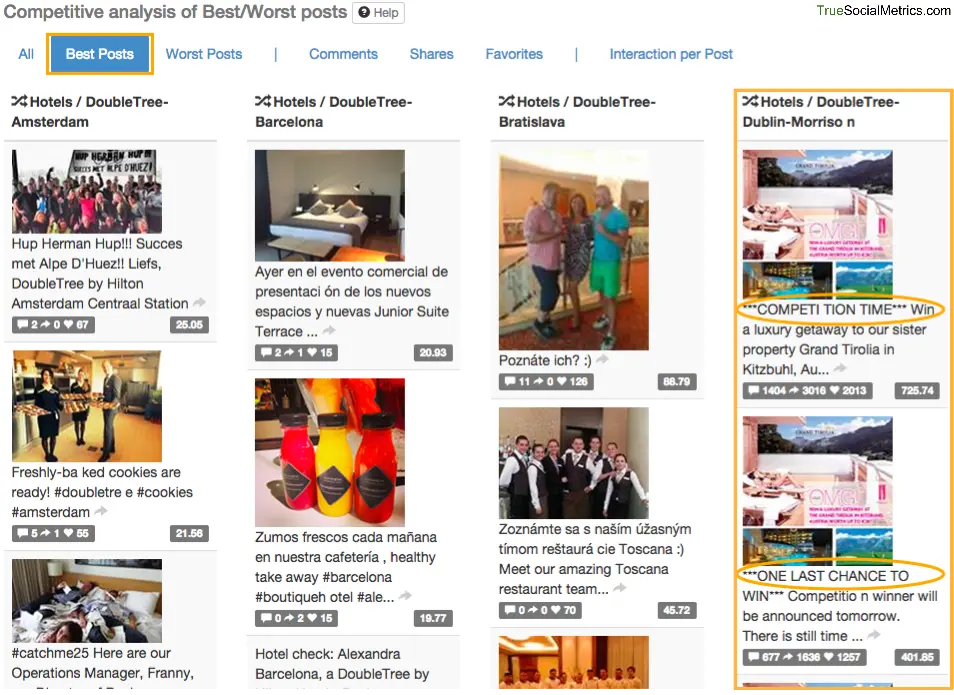
Data from Best/Worst posts report
Read the full case study: Hotels on Facebook: Competitive analysis and content health check-up
Featuring the Competitive Analysis performed with the help of the Competitors Sets, which helped to analyze the brand in 3 different contexts and create 3 different standards to compare with and 3 sources for benchmarking effective content tactics: competitors, sister-brands, and fellow-brands from the same hotel chain.
4 tips on how to benefit from the Competitive Analysis
- Compare general Performance
- Analyze Best and Worst content
- Compare Posting Density
- Compare Followers Quality
Compare general Performance
Use Relative metrics to accurately compare several accounts with different numbers of Followers. By default, Relative metrics show the activity per 1000 Followers (you can select by how many).
Use Relative Metrics report for a quick snapshot and comparison in %;
Relative Trend report for historical changes overview;
and Relative Metrics report for a convenient instant comparison.
Analyze Best and Worst content
Use Post report to analyze your competitors' Best/Worst posts and compare with your own content strategy. Borrow great posts ideas from your rivals and get insights how to engage your followers more.
Read the full case study: Luxury Brands On Facebook
Compare Posting Density
Use Posting Density matrix Analyze the effectiveness of your Posting Density compared to competitors. Is your brand a chatterbox: posting too much with no one listening; or is it true orator: a word aptly spoken is like apples of gold.
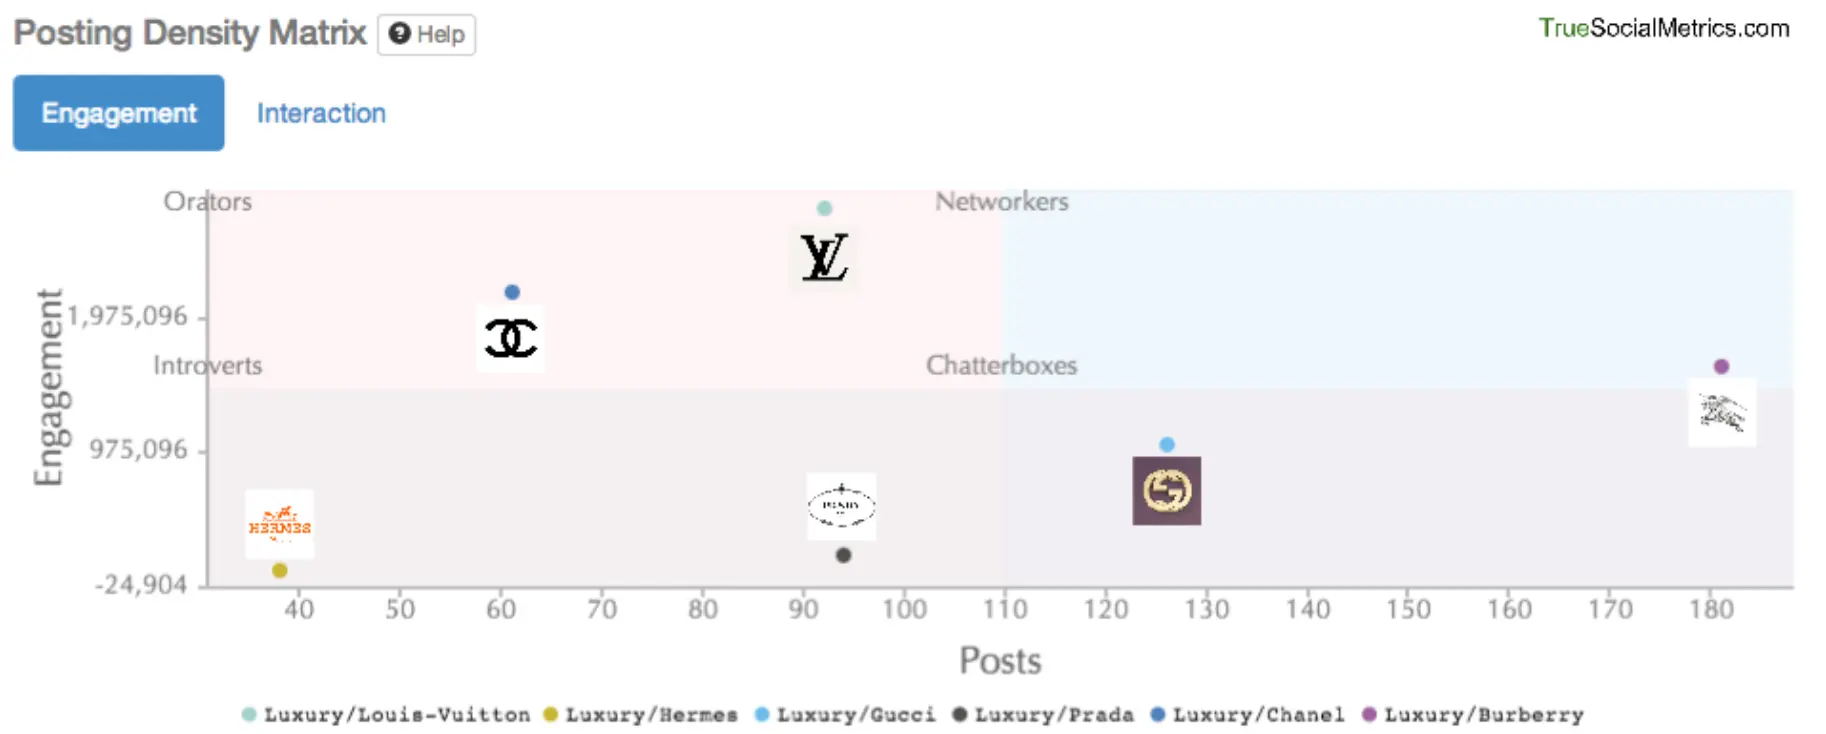
In this example, Chanel and Louis Vuitton are true orators. Posting 3 and 2 times less than Burberry they managed to get 30% and 70% higher Engagement respectively. Which means they are spending less resources on content creation but are still getting more attention.
Read the full case study: Luxury Brands On Facebook
Compare Followers Quality
Use Engagement matrix to find out how active are your followers compared to competitors' fans. Are they just a small pack of inactive acquaintances or are they super engaged innumerous tribes.
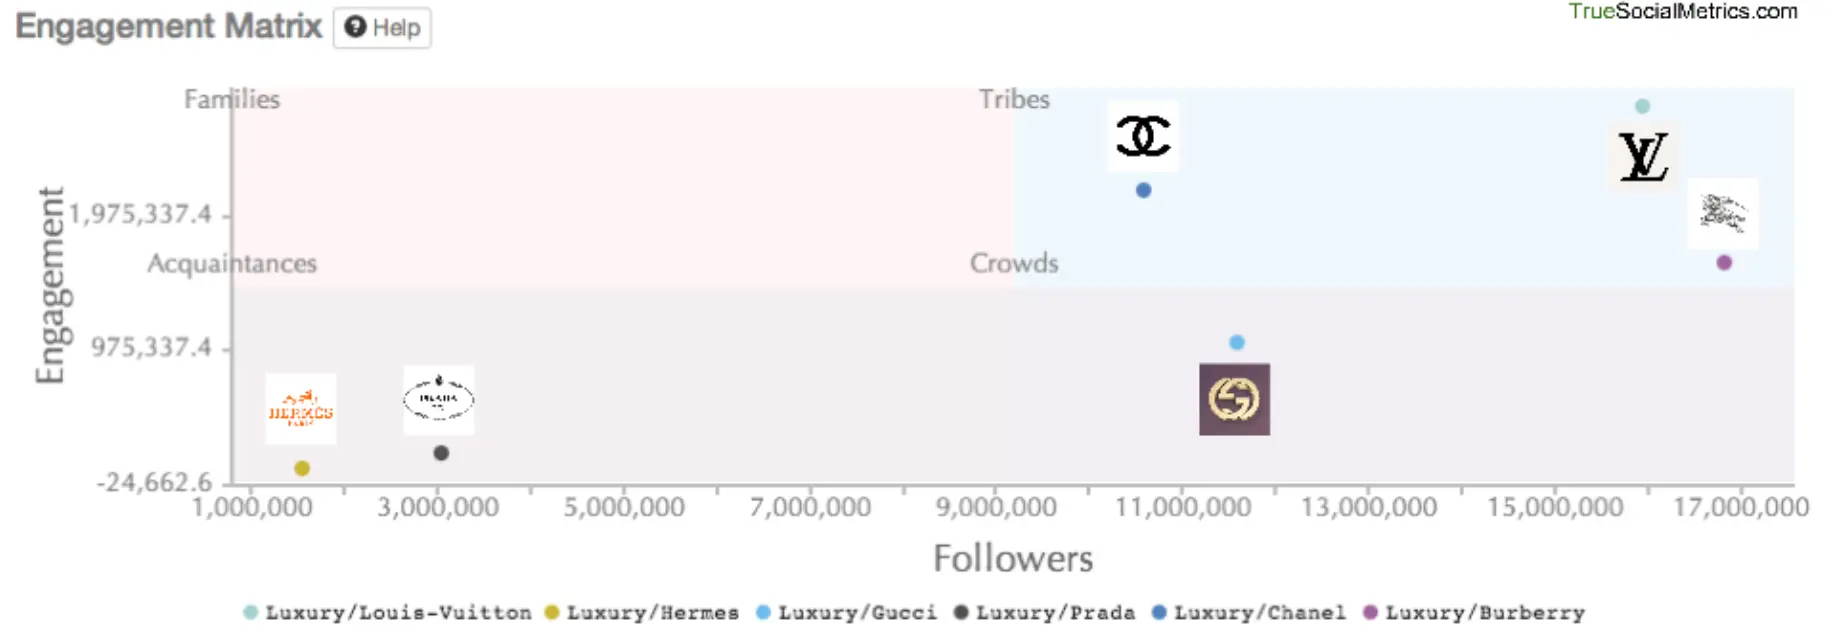
In this example, Burberry, Chanel and Louis Vuitton have active ‘Tribes’ of Followers. While Gucci has a huge ‘Crowd’ of less active fans - with 9% more followers than Chanel has, Gucci received 50% less engagement than Chanel. Maybe Gucci should improve their content strategy by posting more engaging content, adjusting their posting time according to the time when followers are the most active, or improving their followers’ acquisition strategy.
Read the full case study: Luxury Brands On Facebook