Custom segments
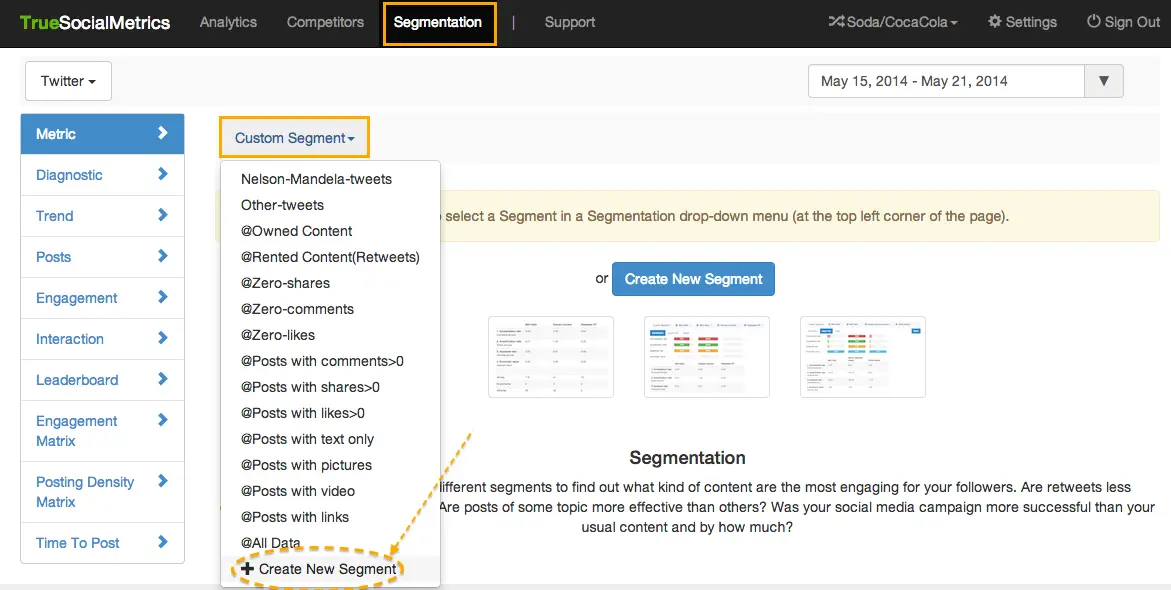
Custom Segments allow you to segment data based on different parameters. For example, you could select to see only posts containing a particular hashtag, or all non-viral posts, or posts with an above average performance. You can compare several Segments to find out what type of content is the most engaging for your followers.
How to create segments
1. You can create a new Segment by clicking on the 'Create New Segment' option in the ‘Custom Segment’ drop-down menu at Segmentation tab. Alternately, you can click on Settings -> Segment page.
2. You will see the following form, which has four fields:
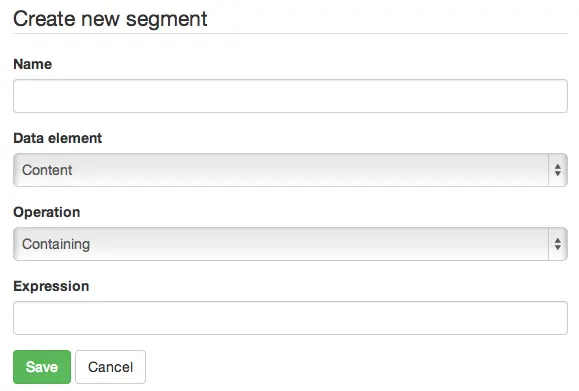
Data element
This is the element of data that you wish to use to segment your results. It has five options:
- Content
- Number of Comments (per post)
- Number of Shares (per post)
- Number of Likes (per post)
- Post type (Text, Image, Video, Link)
Operation
This is an operation that will be applied to your selected data element. It has seven options:
- Containing
- Not containing
- Equals
- Greater than
- Lower than
- Matching RegExp (Matching Regular Expression; you can read how to use Regular Expressions here)
- Not Matching RegExp
Expression
This is an empty text field where you need to specify the value of the data by which the segmentation will be performed.
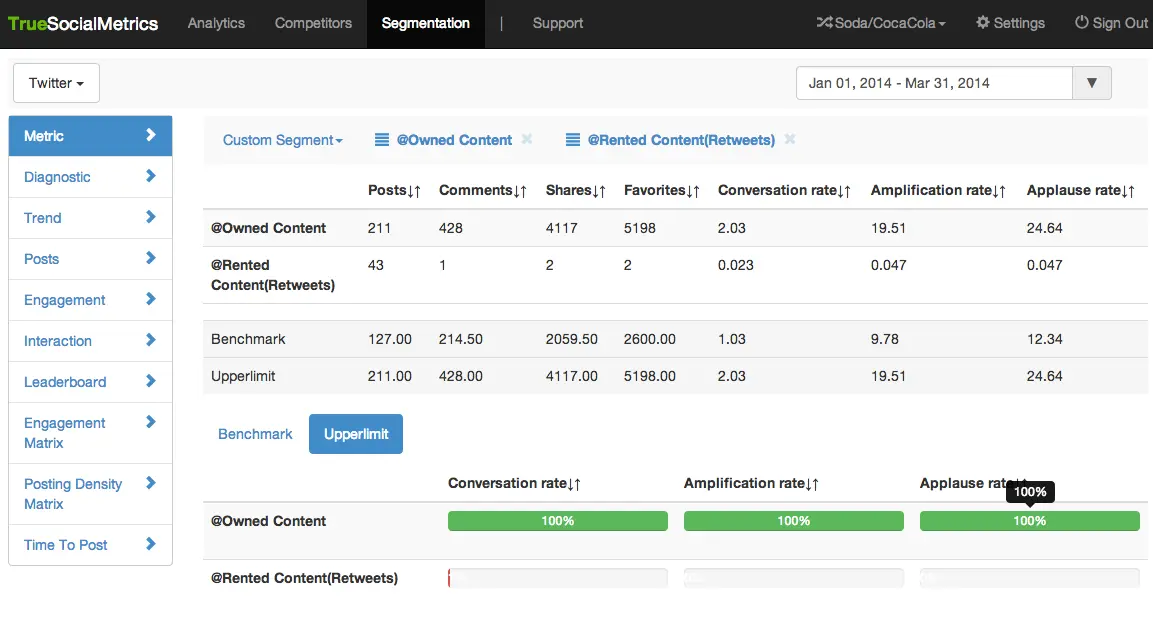
3. To apply a segment to the reports, select the name of the Segment in the ‘Custom Segment’ drop-down menu at the top right corner of the page. To compare several segments with each other and also to All data, use the Segmentation report.
Examples of segments
Campaigns performance analytics
For example, if you wanted to analyze how people engaged with your posts about the SES Chicago conference, you could create a segment for the #seschi hashtag using the following parameters:
- Name: seschi
- Data element: Content
- Operation: Containing
- Expression: #seschi
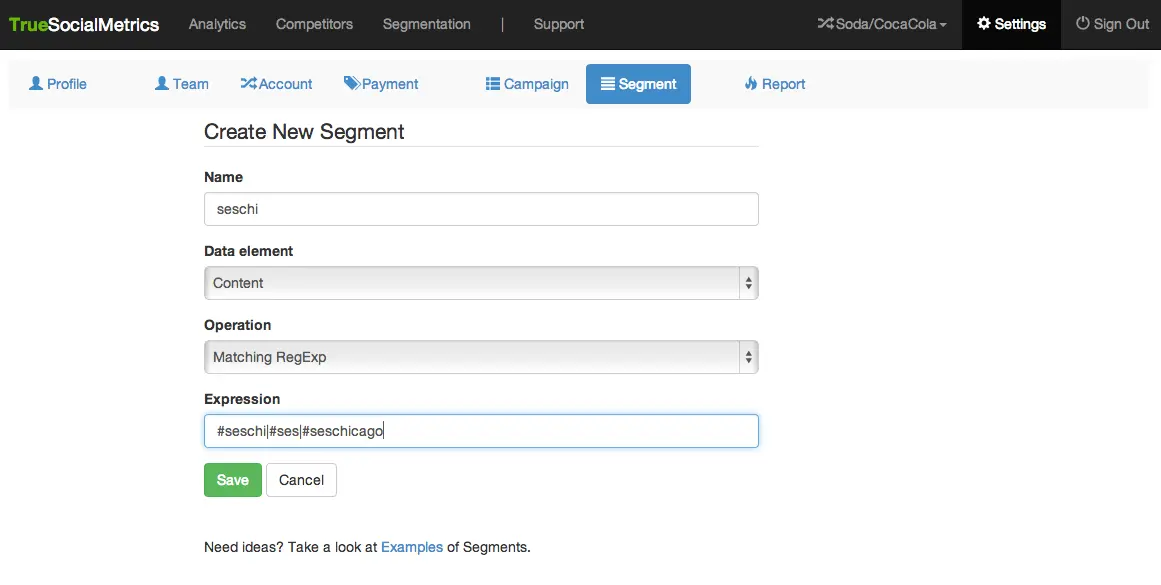
If you wanted to include several hashtags in one segment, you would use the following parameters:
- Name: seschi
- Data element: Content
- Operation: Matching RegEx
- Expression: #seschi|#ses|#seschicago
Comparing segments to find the most engaging content
For example, you can analyze how retweets perform compared to your own content. To do this, you need to create 2 segments with the following parameters, and then compare them using the Segmentation report:
-
Name: Rented-content
-
Data element: Content
-
Operation: Containing
-
Expression: RT @
-
Name: Owned-content
-
Data element: Content
-
Operation: NOT-Containing
-
Expression: RT @
Best/worst posts analytics
If you wanted to understand which topics are less likely to be shared and why, you could analyze all nonviral posts, that is posts with zero shares. To do this, you could create a segment with the following parameters:
- Name: Non-viral-posts
- Data element: Shares count
- Operation: Equals
- Expression: 0
If you wanted to analyze all superviral posts for 2013, that is posts with an above average Number of Shares, you can use your Amplification rate for 2013 as the value of the average Number of Shares per post for that year. You will then need to create a segment with the following parameters (in the 'Expression' field you would specify your Amplification rate for the investigated period):
- Name: Super-viral-posts
- Data element: Shares count
- Operation: Greater than
- Expression: 14
For more information please Contact us.