Top 5 American Pizza's Brands in Social Media
by Member of TrueSocialMetrics team ~ 7 min
We've compared the Facebook activity of the top 5 American pizza brands to see who rocks in Social Media Marketing.
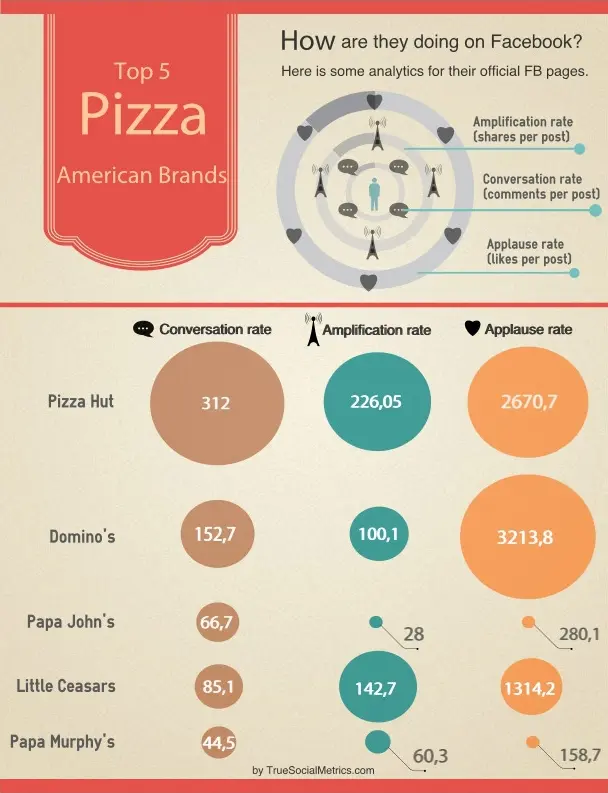
Looks like Pizza Hut is #1 not only in pizza, with very promising and balanced stats in all three metrics. Surprisingly, Domino's are totally leading in Applause rate. Although sadly that’s in huge disproportion to the Conversation and Amplification rates. Lots of Likes means that they have an emotional content, which is good for creating loyalty to the brand, since with a higher level of loyalty, the customer lifetime value is longer and creates higher profits for the company. On the other hand, liking is the least engaging activity a fan could do, when compared to commenting and sharing. So Domino's should consider using posts that are more engaging to its fans. Papa John's social activity looks dangerous. Why do people comment but not share or like? Maybe they use company's page for complaints? Regardless, having only 20-30 shares for posts that promote discounts is strange for a page with 2 million fans.
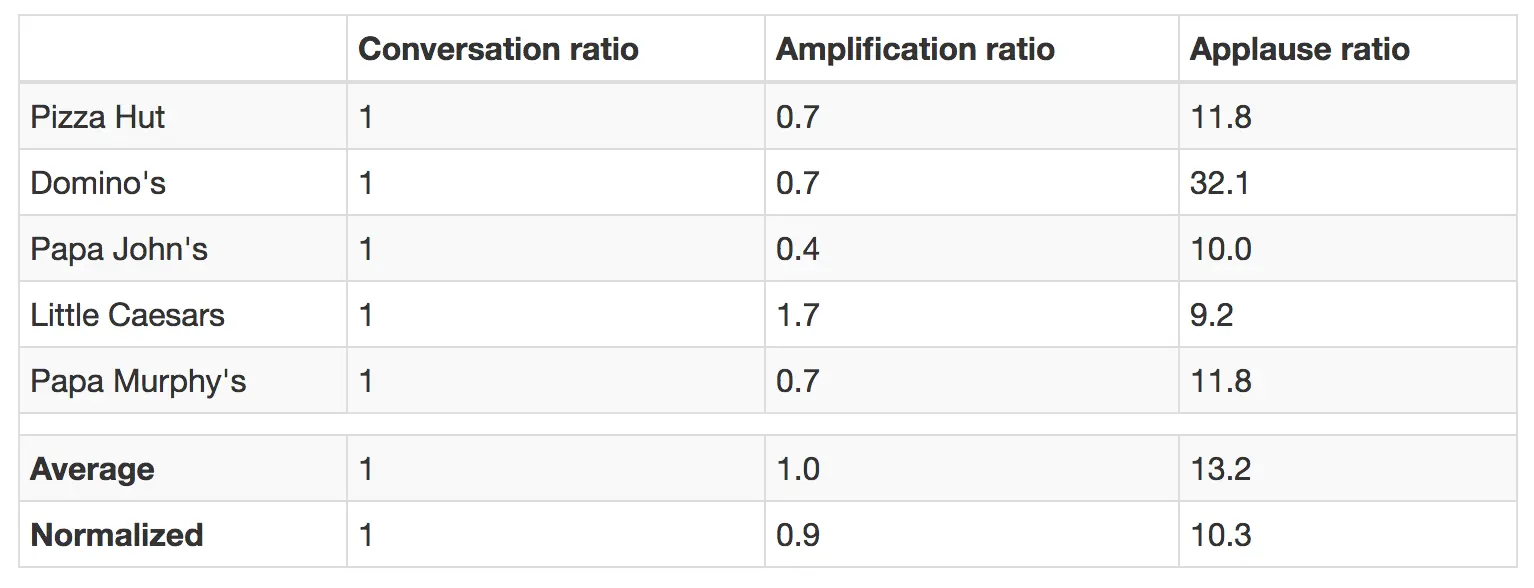
It’s also interesting to trace the ratio between Conversation, Amplification and Applause rate, to find out if there is a standard proportion for some social networks or industries, and so on.
So here’s what we found:
| Brand | Conversation ratio | Amplification ratio | Applause ratio |
|---|---|---|---|
| Pizza Hut | 1 | 0.7 | 11.8 |
| Domino's | 1 | 0.7 | 32.1 |
| Papa John's | 1 | 0.4 | 10.0 |
| Little Caesars | 1 | 1.7 | 9.2 |
| Papa Murphy's | 1 | 0.7 | 11.8 |
| Average | 1 | 1.0 | 13.2 |
| Normalized | 1 | 0.9 | 10.3 |
This is how the ratios are calculated, for example, for Pizza Hut: we compared metrics to the Conversation rate so we assigned it a ratio of 1. Then we divided the Amplification rate by the Conversation rate to find out how the first metric differs from the latter, that is (226.05/312) = 0.7. The same is done with the Applause rate: (2670.7/312) = 11.8, which means the Applause rate is 11.8 times higher than Conversation rate.
To find out the common trend, Normalization techniques were used. In our case, normalized means calculated without the highest and the lowest results in the data row. For example, the Amplification ratio normalized average would be calculated without the lowest 0.4 and highest 1.7 numbers of Papa John’s and Little Caesars, respectively. Normalization helps to receive cleaner result by excluding peaks.
So the final result is 1 : 0.9 : 10.3 ratio between Conversation : Amplification : Applause in Facebook for pizza brands in America. Roughly speaking, this means that the most common proportion is 1 comment : 1 share : 10 likes per post. Of course for more accurate results, more brands would need to be included, but this is a task for another article in the future :)
The next step is to understand the level of activity of Fans for each account. For that purpose, we will calculate Relative Metrics averaged by the number of Followers. For example, Weighted Conversation rate for Pizza Hut is (312/8083591)*100 = 0.004. It means that, on average, 1 Fan leaves 0.004 of a Comment per 1 Post. The lower this rate, the more inactivity the users account has (or the worse content).
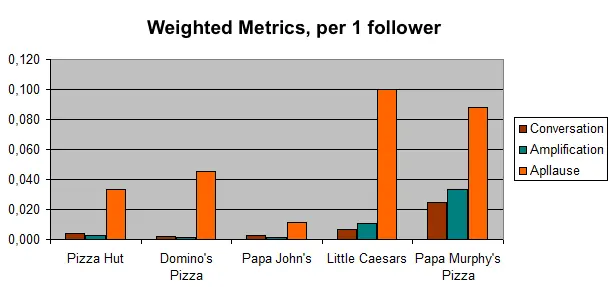
We can conclude that big brands experience more problems with bots and inactive users than smaller brands do. This is not surprising since it’s obviously harder to keep 8 million fans interested and engaged than just 100 of them. It also depends on advertising agencies and the campaigns used - creating bots to boost the page popularity isn’t an uncommon practice. A recent statement from Facebook indicated that 8.7% (nearly 80 220 000) accounts of monthly active users violate the terms of service, which means that they could be bots. So it’s always good to keep that in mind.
The next step in our analysis is content. Here’s the posting density for the last 30 days for each brand. It looks like it’s nearly one post per day (considering there’s 24-25 working days in a month).
| Brand | Posts per 30 days |
|---|---|
| Pizza Hut | 25 |
| Domino's | 25 |
| Papa John's | 24 |
| Little Caesars | 19 |
| Papa Murphy's | 10 |
Pizza Hut
Here is how Posts Diagnostic looks for Pizza Hut:
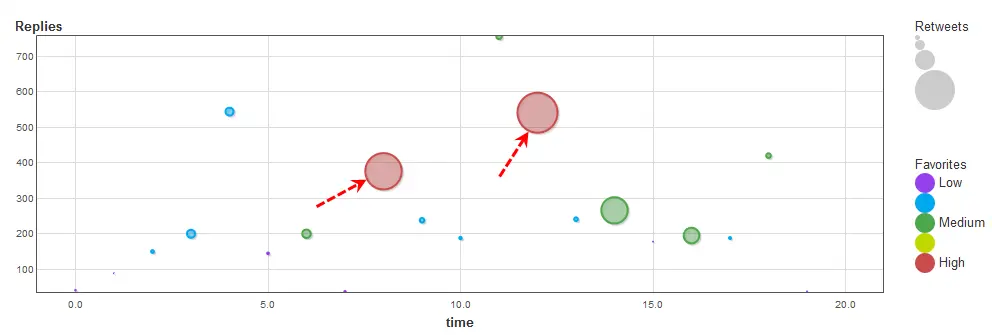
Performed with with Diagnostic report
We’ve got two absolute leaders in the likes/shares.
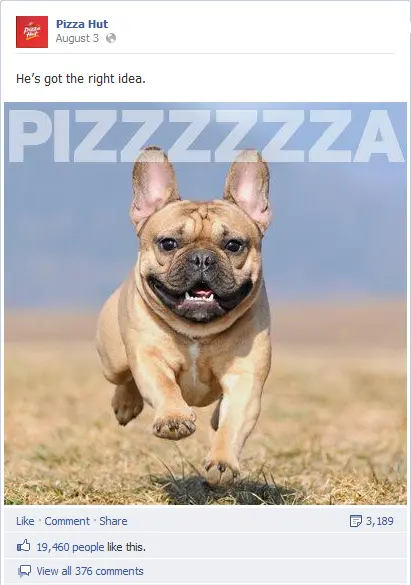
The Best Post Ratio for this post is 1.2 : 14.1 : 7.3, which means that the Conversation rate is 1.2 times higher than average for that account, the Amplification rate is 14.1 times higher, and the Applause rate is 7.3 times higher.
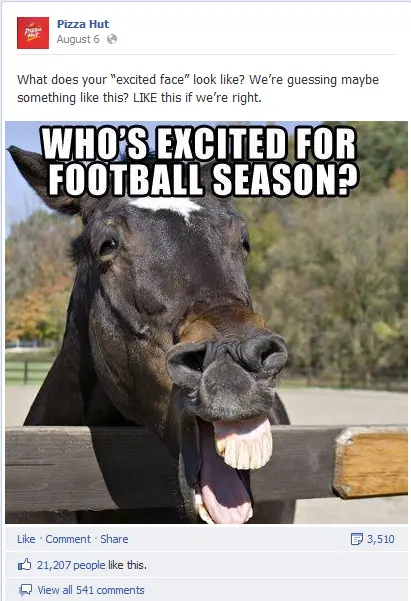
The Best Post Ratio for this funny horse is 1.7 : 15.5 : 7.9. It looks like Pizza Hut used the old ‘children and animals’ trick :) Although without the children, yet.
Domino's
Let’s look at their posts:
Performed with with Diagnostic report
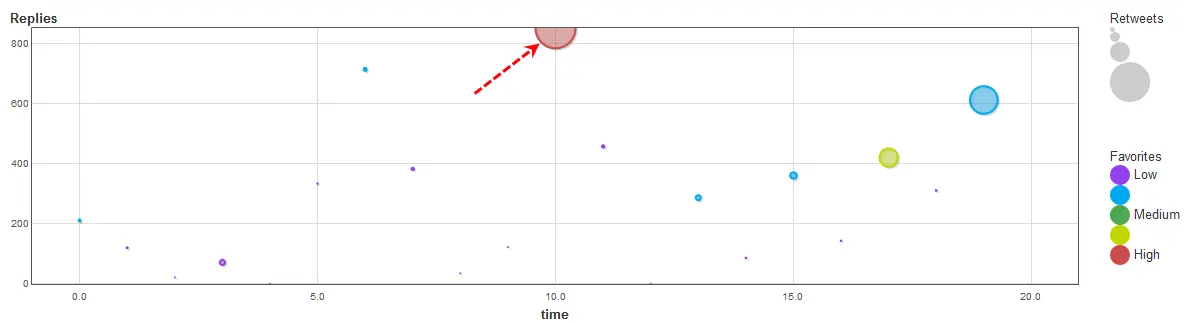
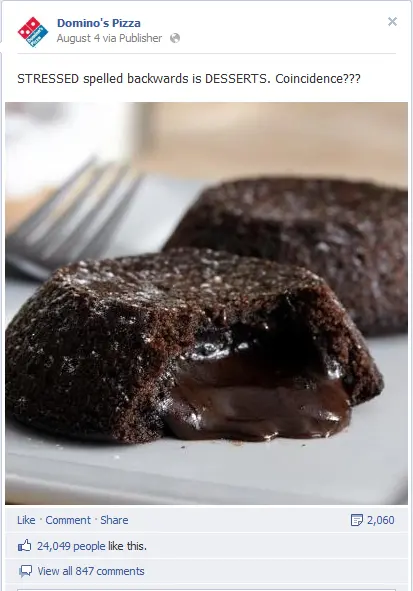
They’ve got an absolute ‘star’ post by all three dimensions - comments/shares/likes. Compared to that post, all other posts look quite mundane. So here’s the content of this champion post:
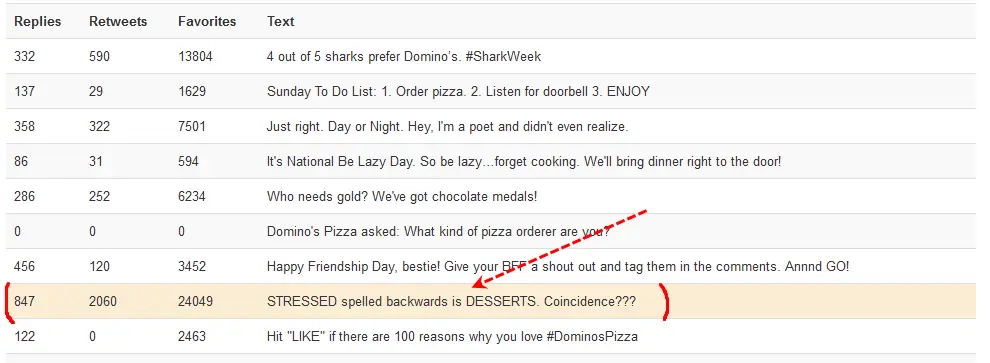
Performed with with Diagnostic report
The “Stressed Desserts” post has a Best Post Ratio of 5.5 : 20.6 : 7.5, which means that its Conversation rate is 5.5 times higher than average for that account, the Amplification rate is 20.6 times higher, and the Applause rate is 7.5 times higher. This post would totally deserve the prize of “Post of the month”. And here is how it looked on the page:
Papa John's
More colorful circles for Papa John’s:
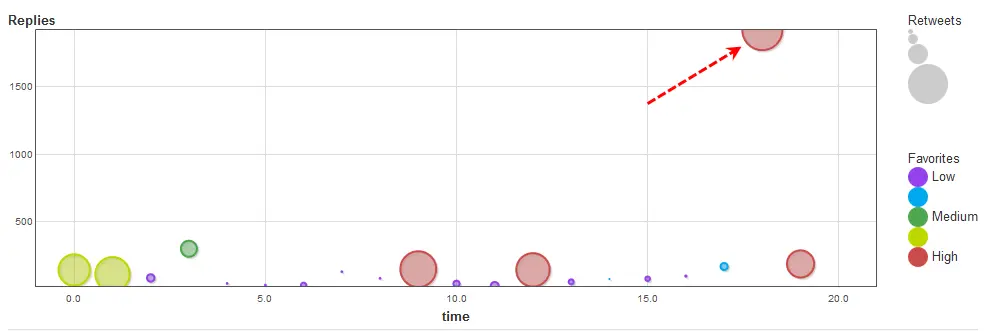
Performed with with Diagnostic report
They have an absolute standout post based on replies, likes and shares:
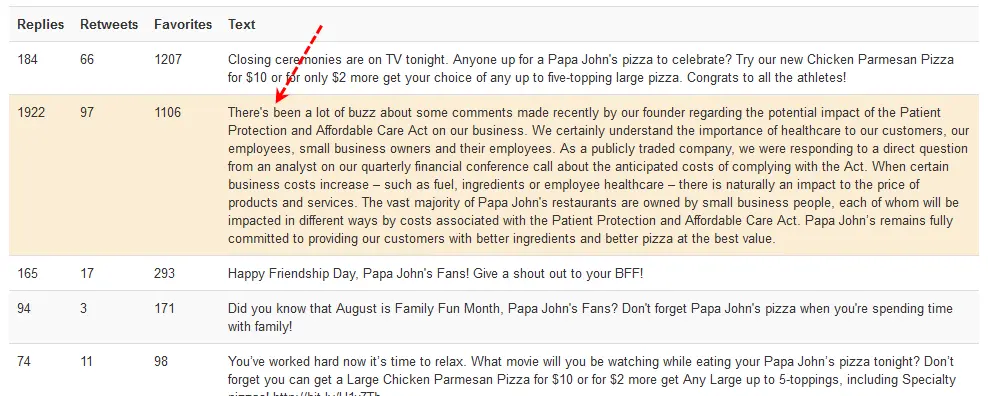
Performed with with Diagnostic report
Unfortunately, the post is very controversial and its stats look nice only until you look at the comments:
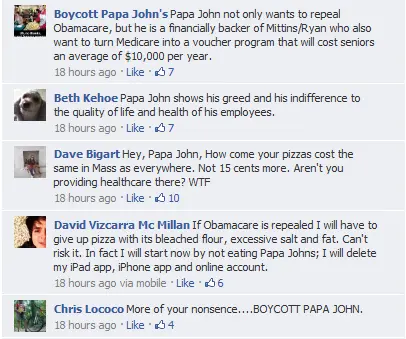
So it looks like our previous assumption about the usage of this page as a place for complaints is close to reality.
Little Caesars
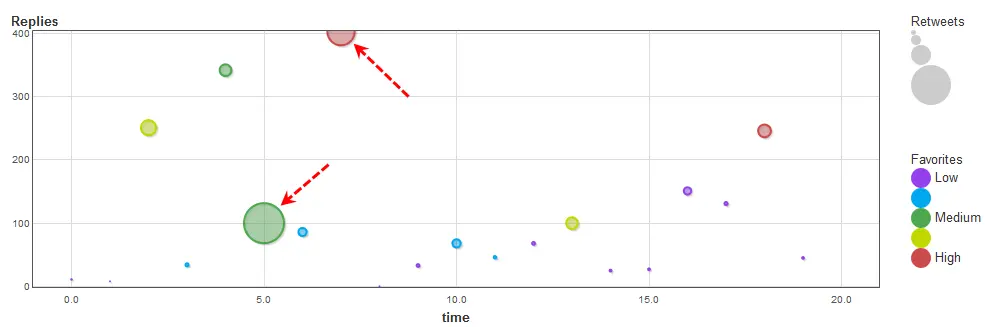
Performed with with Diagnostic report
Their replies and likes leader:
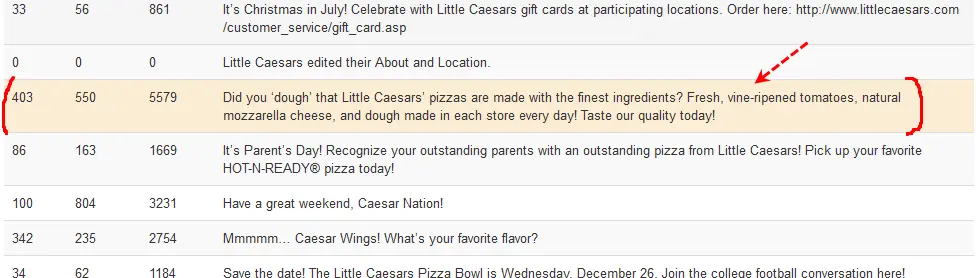
Performed with with Diagnostic report
We can draw a parallel here with Domino’s best post – it looks like fans love wordplay.
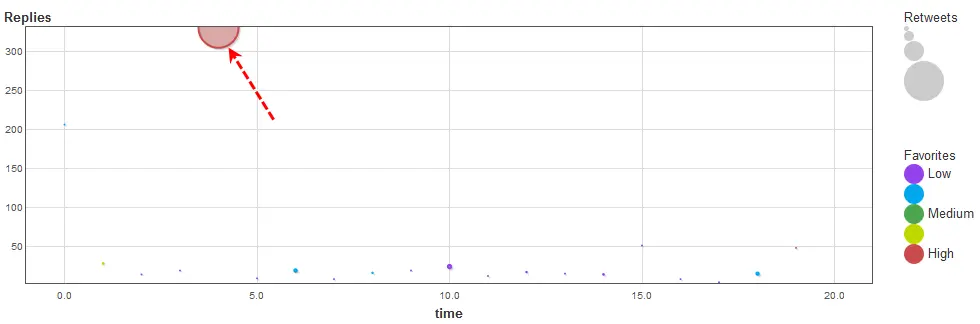
And their shares leader:
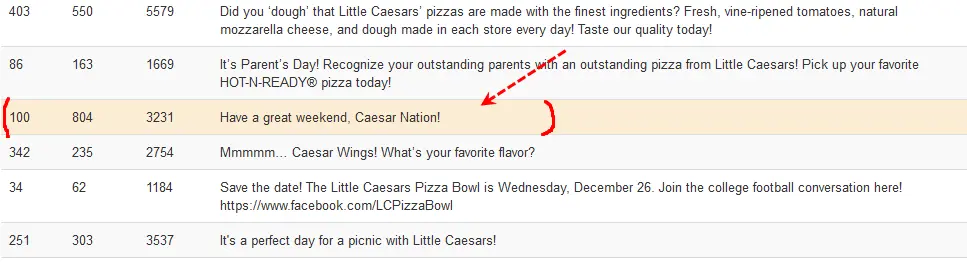
Performed with with Diagnostic report
Papa Murphy’s
The ‘huge-radiant-sun’ post in Papa Murphy’s diagnostic chart:
Performed with with Diagnostic report
In this case, the post will tell the story for itself:

This is a good lesson for every business - you are people in the first place...
When you’re ready to rock your social media analytics
give TrueSocialMetrics a try!
Start Trial
No credit card required.
Continue reading
Why Measuring the Number of Followers is a Bad Idea

Why You Should Stop Trying to Measure ROI for Social Media Marketing

Luxury Brands on Facebook: Analyzing Best and Worst Content, or Why Prada Fans Hate Suits

10 Tips to Start Making Amazing Content Right Now
