The Most Viral Type of Pins: Barney’s on Pinterest
by Member of TrueSocialMetrics team ~ 4 min
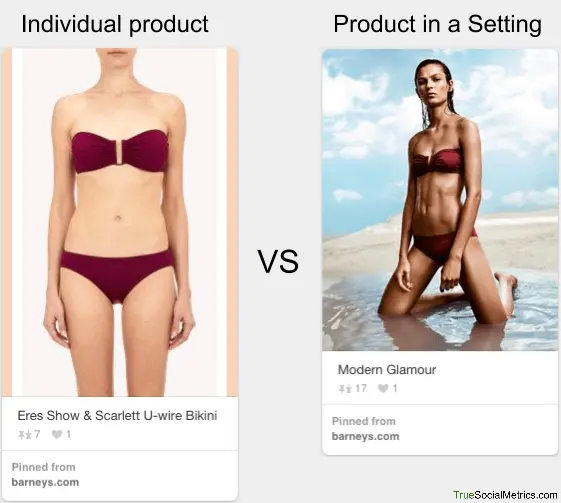
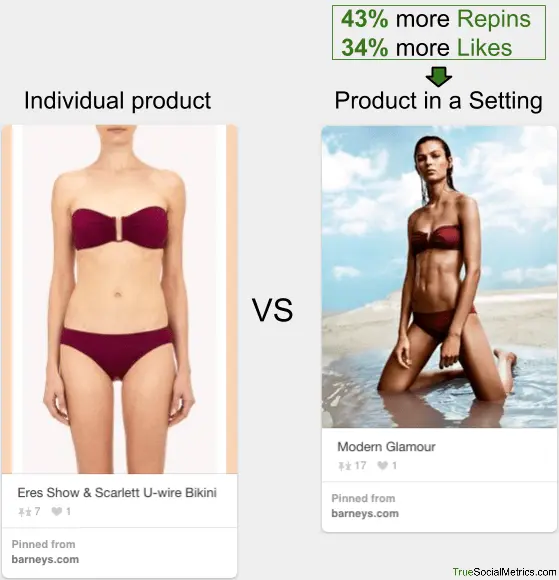
When I studied the top retailers on Pinterest I stumbled upon an interesting technique Barney’s uses to present their clothes and accessories. They always make 2 types of pins for each product:
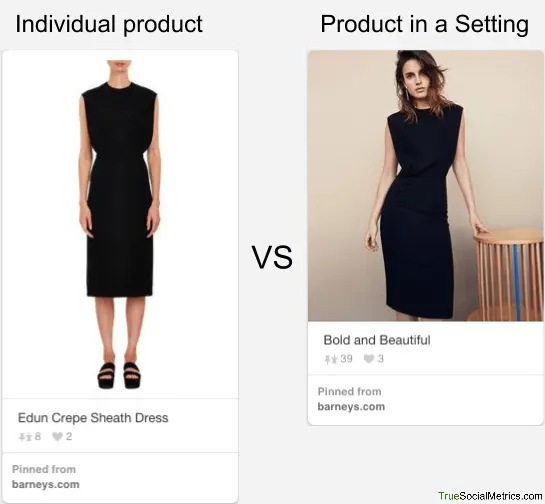
- an “Individual Product” - a simple photo of a product with a white background.
- a “Product in a Setting” - a beautiful artistic photo with a beautiful model and a pretty background, demonstrating a real-life usage of a product.
A few examples:
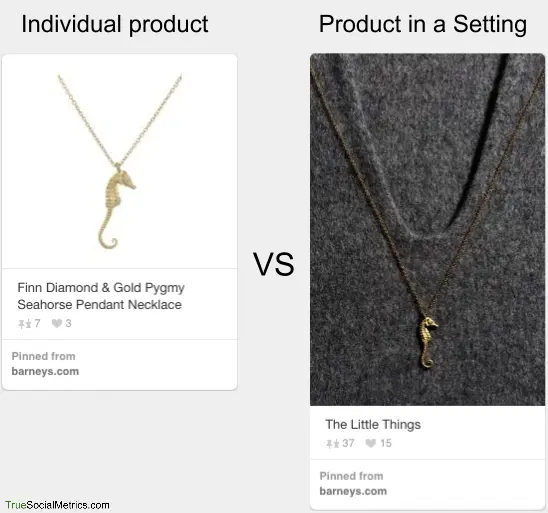
The same with jewelry (also notice the much better quality of the second photo):
But why on Earth do they post both pins? Bonnie Gross, Target's VP of Digital Marketing & Loyalty, has answered this question in her presentation: 'Product in a Setting' pins give you an inspiration by showing a real example of how the products could be used, while 'Individual Product' pins boost your imagination giving some free space to imagine how you can use the products your own way.
Of course, I couldn’t just walk by and not compare the effectiveness of both methods of product representation. An almost perfect AB test. Which one is more likely to be re-pinned and liked - an “individual product” or a “product in a setting” format?
So I used the Content Segmentation feature to separate these two kinds of pins from each other and compare their effectiveness. Luckily, Barney’s used specific keywords for each collection and each of the two types of pins. They have several series of pins; each dedicated to a different collection. I've compared 8 of these series posted between Dec ’14 and Feb ’15.
Here’s how the 2 complementary Segments looked for each collection - one segment is for “Product in a Setting” pins and the other one is for “Individual Product” pins:
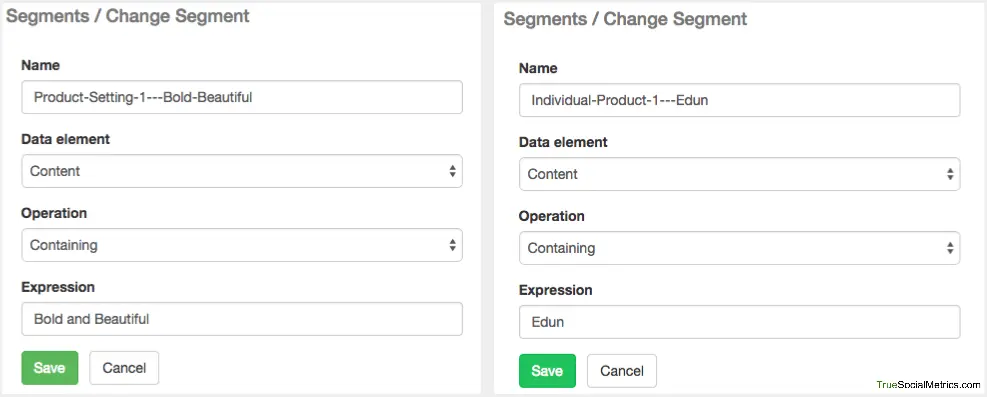
Performed with Segmentation feature
Then I compared complementary segments with each other (for each of the 8 collections) by these 3 metrics:
- Conversation rate = Number of Comments per 1 pin
- Amplification rate = Number of Repins per 1 pin
- Applause rate = Number of Favourites per 1 pin
These metrics help evaluate the effectiveness of an average pin from each group through all types of social interactions. For simplicity of comparison, the biggest values are represented by 100% and other values are compared with this maximum to see by how much the results are lagging from the leader. Here’s what we got:
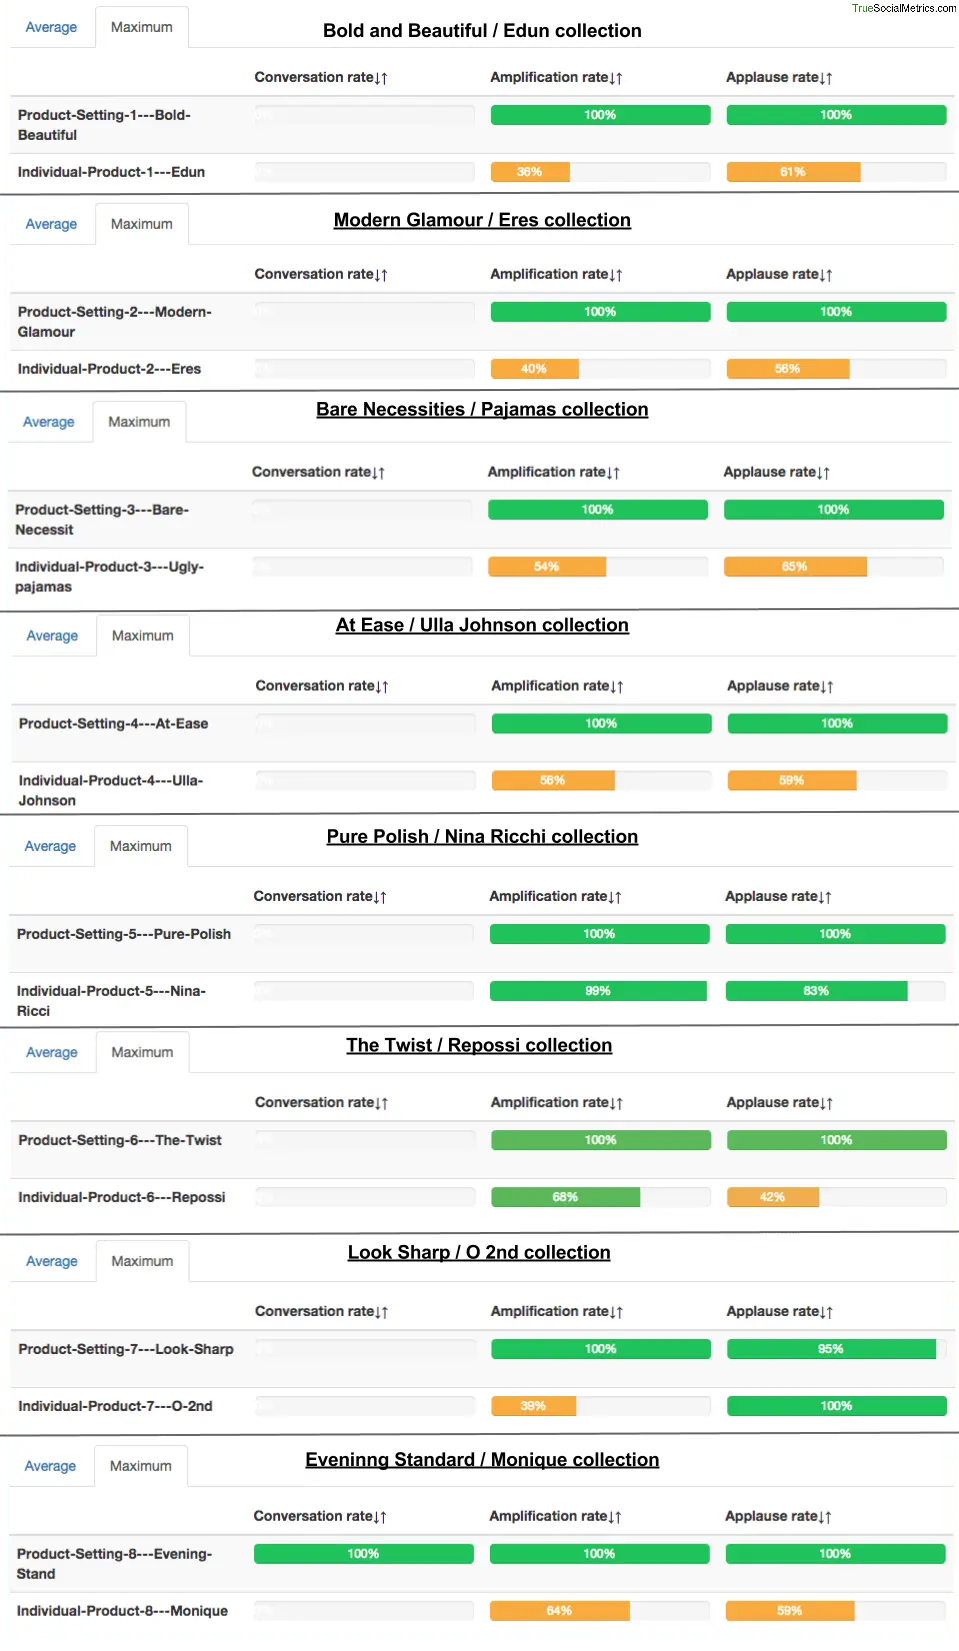
Performed with Segmentation - Metrics report
Will you look at that! Almost all of the “Individual Product” pins did worse than “Product in a Setting” pins, especially by the number of repins per pin - almost 2 times less. This is an obvious turn around - you have more desire to repin artistic photos to your board: The more pleasurable to the eye, the higher the probability of repinning.
The results are pretty much the same for all collections, except the 5th and 7th. Well, of course, artistic pins don’t always win against plain photos, but in general they tend to do better. Based on our analysis, on average ‘Product in a Setting’ pins get 43% more repins and 34% more likes per pin.
Well, nonetheless, it looks like this dual-pins technique is widely used among retailers on Pinterest and has proven its effectiveness despite the obvious differences in engagement level. Otherwise, big brands would not be relying on it.
Takeaways:
- If you are a retailer, try presenting your products on Pinterest in several different ways - product in a setting in addition to individual product photos. Give your customers an inspiration as well as a free space for imagination. And let them decide which type of pin to fancy.
When you’re ready to rock your social media analytics
give TrueSocialMetrics a try!
Start Trial
No credit card required.
Continue reading
Why Measuring the Number of Followers is a Bad Idea

Lock-in Landing Pages - the Way to Nowhere

Fujo's Steps for Social Media Success

Fast food on Twitter: when to post, so you don't miss out
