Lock-in Landing Pages - the Way to Nowhere
by Member of TrueSocialMetrics team ~ 5 min
Lately, lock-in landing pages have become more popular because they claim to increase conversion rate. The general idea of such a page is to remove all the destructions, unimportant parts of a page, to help people walk straight to the goal.
As for the contrast, look at the Payoneer site. Maybe it’s not super fancy, but it works:
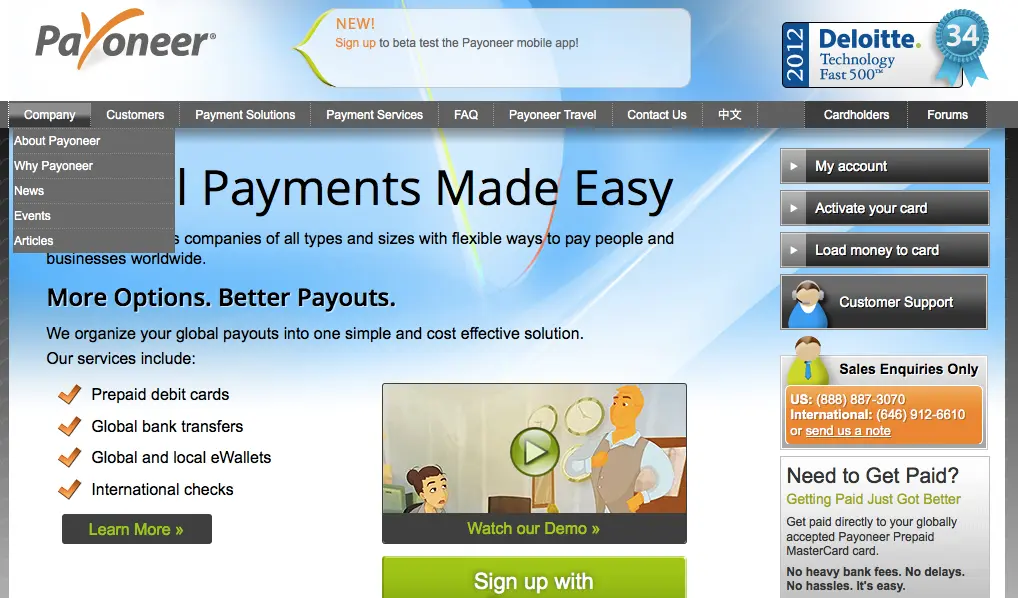
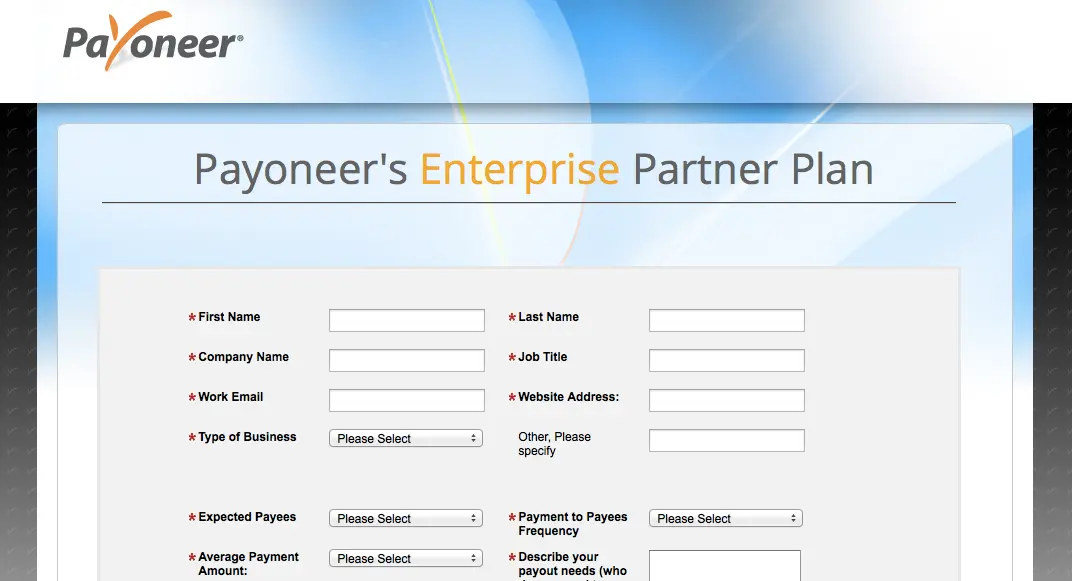
As you can see, the whole page is a registration form, but the landing page has a lot of elements with a big Sign up button. This is effective for several reasons:
- People can access more information about the company
- The choice, to register or not, belongs to the customer
- The landing page provides a short product description
- There is a link to the homepage which allows people to go to a full version of the site
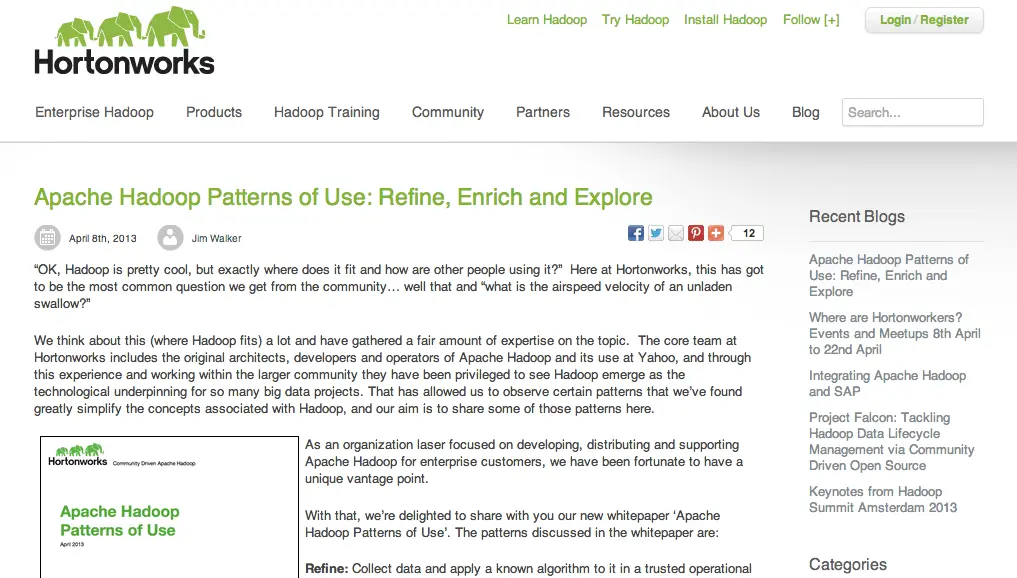
But lately, especially with things promoted on LinkedIn, I’ve noticed an increasing number of Lock-in pages used. Just look at the HortonWorks:
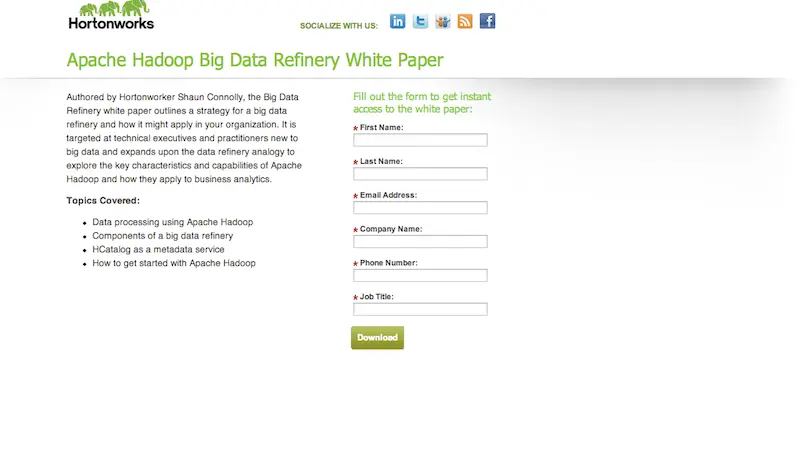
- It does NOT have any exits! There’s no link to a full version, more information, prices, absolutely nothing
- There’s NO information about the product
- There’s NO information about the company
- Only one way out - registration
A closer Look
Prison pages increase retention rate. But how about people? Do they love prison-like sites? Do they keep using your product after they escape to freedom? So many questions but the answers are much deeper. At a first glance it brings a significant increase to the registration rate, but you will pay for it with your retention rate. Usually, the path isn’t as straightforward as you may think. I’ve used my site stats as an example. Let’s look at the Visitors Flow report.
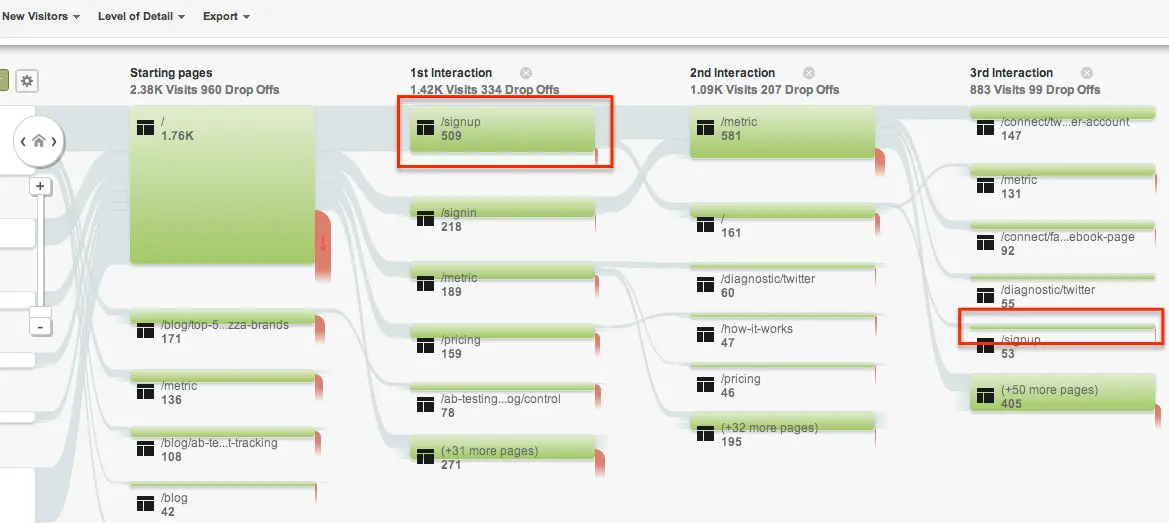
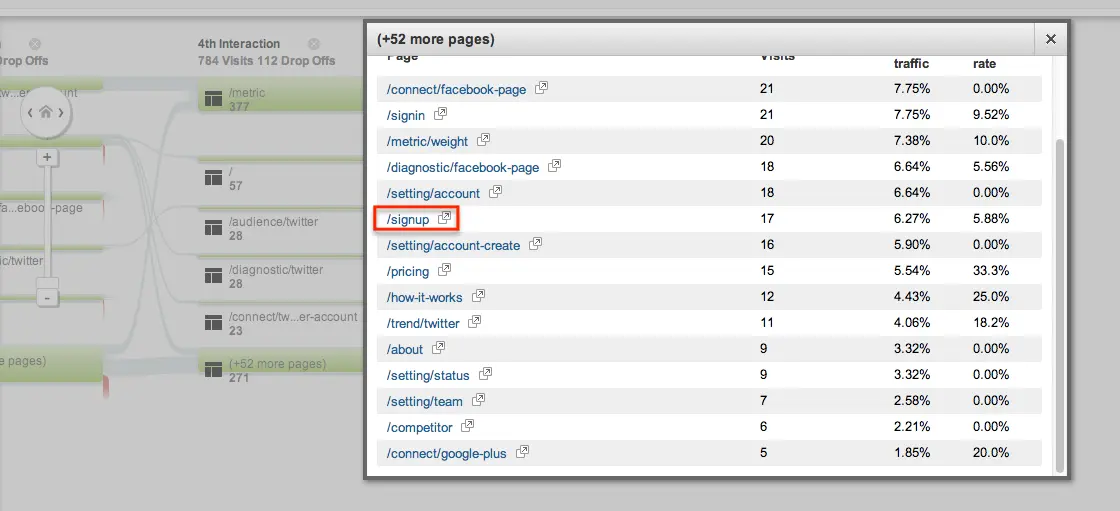
In general only 1/4 of visitors take a straight path: landing page => sign up, and almost 3/4 prefer to get more information about the site before performing any business action. How about looking at real data from web-server access logs.
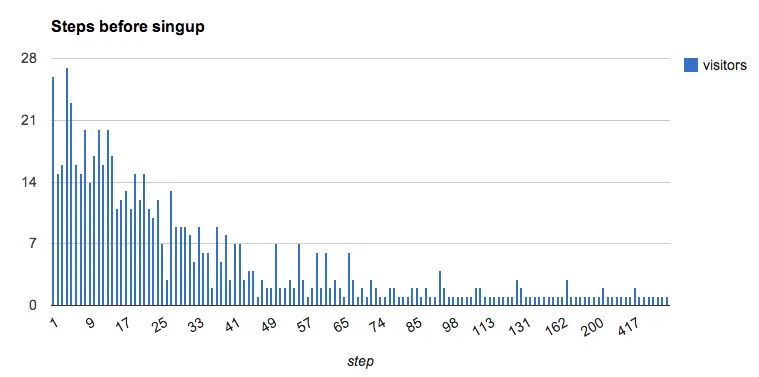
Based on this chart 50% of registered users make from 1 to 34 steps (interactions) to registration and the remaining 50% from 35 up to ∞ steps. Let’s look at the retention rate (how many customers you will have after a registration day).
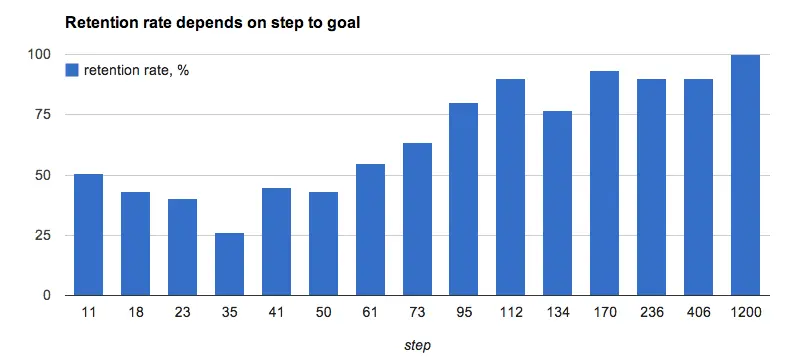
If we analyze the two graphs in combination we will notice that the average retention rate for 1 to 34 steps conversion path is about 33%, but the long tail (users with > 35 step conversion paths) has, on average, a 70% retention rate. Let’s look at a scatter plot of this data.
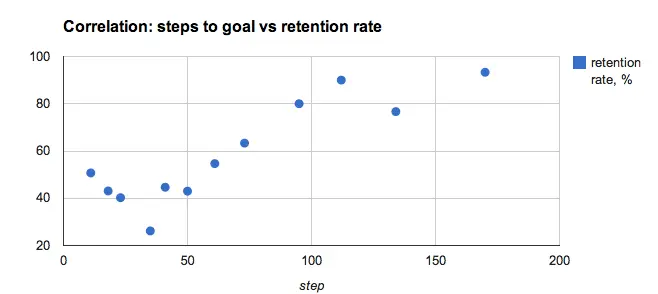
It shows a very strong positive correlation between variables - steps in conversion path to registration and retention rate. Pearson’s coefficient = 0.85!
How about profit?
I will use HortonWorks as a sample. One click in LinkedIn costs on average $2.50, but the conversion rate is only 4% and retention rate for 1 page registration is about 10%. This means 1,000 visits provides you only 40 clients, then you will lose 36 people on poor retention rate and finally end up with only 4 customers whose loyalty is questionable. But for 1,000 clicks you’ll have to pay:
1000*$2.5 = $2500!
And the acquisition cost per user will be:
$2500/4 = $625
That’s a lot, if you keep in mind that you can spend 20 times less money simply by abandoning lock-in pages for normal pages. So if they use a lock-free landing page - registration costs would be $31 and it means they would save $600 on each client and can attract another 20 people with the saved money.
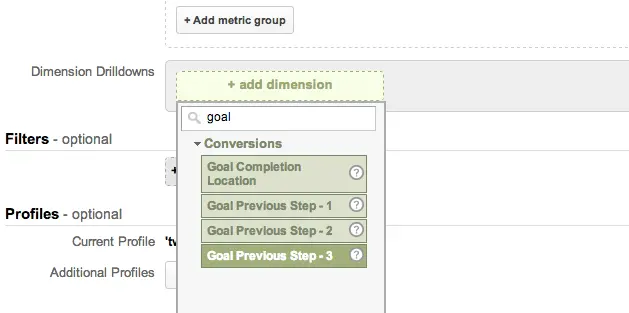
Why I didn’t use Google Analytics?
Because Google Analytics current report, “Reverse Goal Path”, shows only the 3 last steps of the path which is NOT exactly what we were looking for. And even if you try to customize it you can’t get stats on more steps.
Key findings
- A one-step registration path is only 3-5% of total traffic.
- Making lock-free landing pages can help you to deal with all the remaining 95% of potential customers.
- Focusing on the long tail (users with multi-step conversion paths) will bring you more loyal customers and increase CLTV (customer lifetime value).
- You have to study and analyze your customers’ paths.
I’ve made a few scripts for my web-server logs to get those reports:
- extractor - extracts and compresses *.gz logs and removes unused error logs
- analyze-goal - steps to goal calculation
- analyze-retention - retention rate depends on steps to goal
* Please make a logs copy before running any scripts, because they are removing some parts.
** When using any of the scripts you need to change $goal, $retention variables to your pages.
Update from 04/10/2013
Finally, they have changed the landing page for a new promotion campaign in Twitter and Linkedin. It seems the world is starting to become a better place.
When you’re ready to rock your social media analytics
give TrueSocialMetrics a try!
Start Trial
No credit card required.
Continue reading
Conversation / Amplification / Applause Rates Usage Best Practices

Google Plus Communities Analytics: Social Media Communities

Analyzing The Best Facebook Campaigns 2012

The Most Viral Type of Pins: Barney’s on Pinterest
