Google+ Communities: Analyzing Community Health
by Member of TrueSocialMetrics team ~ 5 min
If you are a community owner or just evaluating in which community to participate or represent your brand, it's a good thing to study a community's health and see what's going on behind the bare Number of Followers. More than a year has passed since I studied the top 5 social media marketing communities on G+ and I was curious to see what had happened to one of them - Social Media community during past year. Is it still active and growing, or losing its pace? Let’s dive in to some stats and investigate.

1. Where it stands among the competition.
I’ll start by looking at the metrics and finding out where the community stands among its competition:
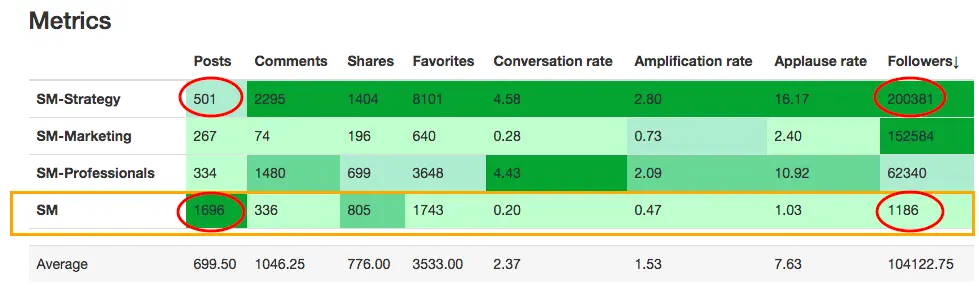
*Conversation rate = Comments per Post, Amplification rate = Shares per Post, Applause rate = Likes per Post
Performed with Competitors Leaderboard report
One of the top 5 communities has disintegrated since 2014, so only 4 of them are left to analyze. Our subject of study, SM community, is the smallest one among the 4 analyzed by the Number of Followers and, logically, has the lowest engagement. What’s strange here is the proportion of Followers vs the Number of Posts. While the biggest community, SM-Strategy, has only 501 posts with 200,381 Followers, our smallest SM community has 1696 posts with 1186 Followers! How is that possible? Either SM’s followers are super active, or the activity in the community is artificially generated by the owners. Anyway, we can’t say anything exact without investigating further.
2. How activity developed over time.
We can see a clear downward trend for all types of social activities during the past year.
Conversation rate trend:
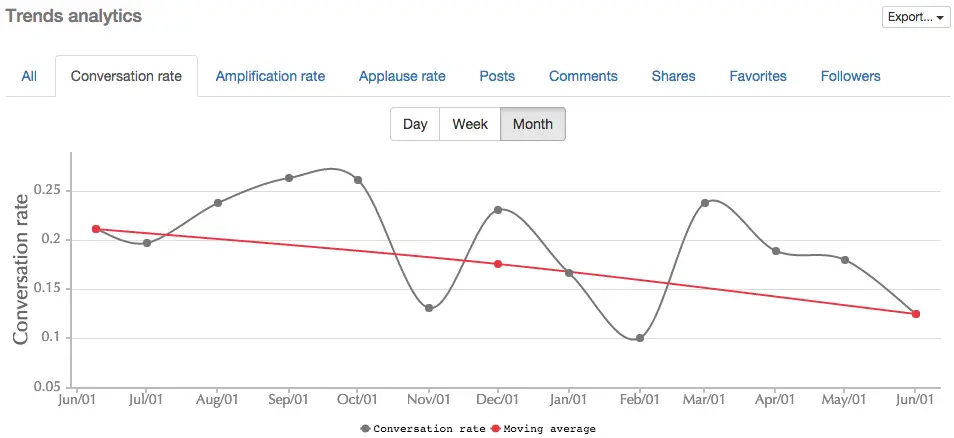
*Conversation rate = Comments per Post
Performed with Trend report
Amplification rate trend:
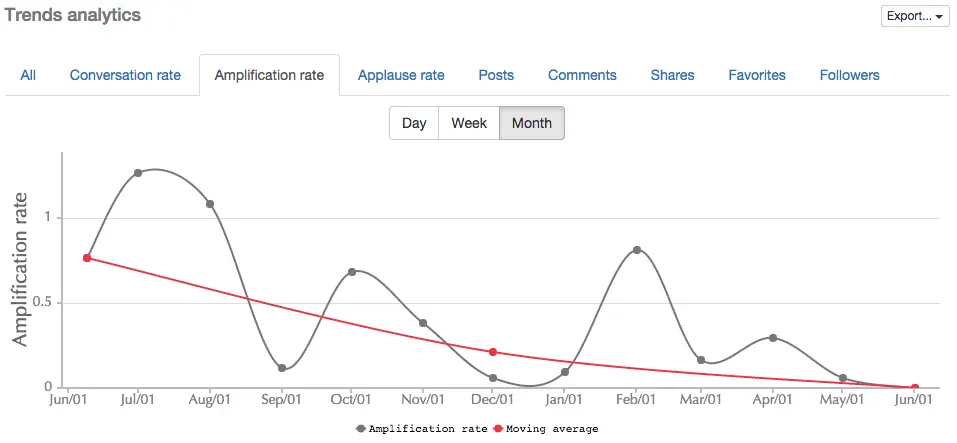
*Amplification rate = Shares per Post
Performed with Trend report
Applause rate trend:
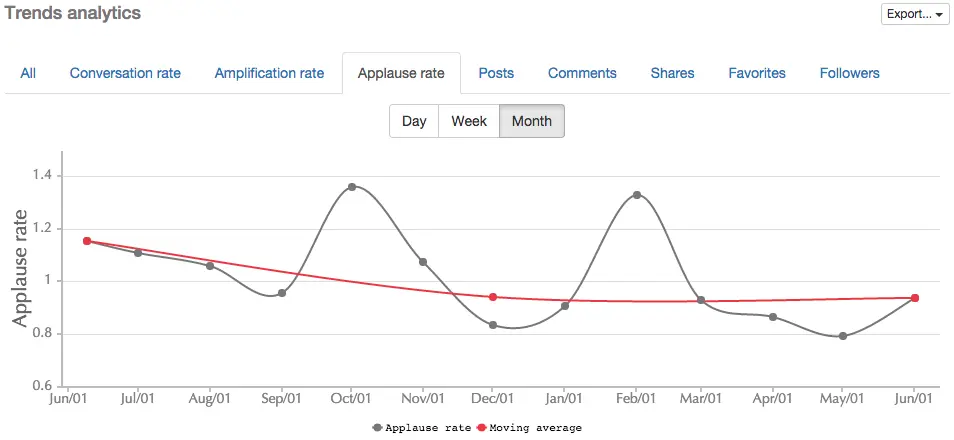
*Applause rate = Likes per Post
Performed with Trend report
So how did this happen and why is the community losing its old glory? Analysis of content health may answer these questions.
3. Content health.
Just a quick look at their posts’ performance over the last year and we can already see that something strange is going on here. This is how average, normal activity should look - a bunch of chaotic colorful confetti. Lots of posts with different levels of engagement at SM-Professionals community:
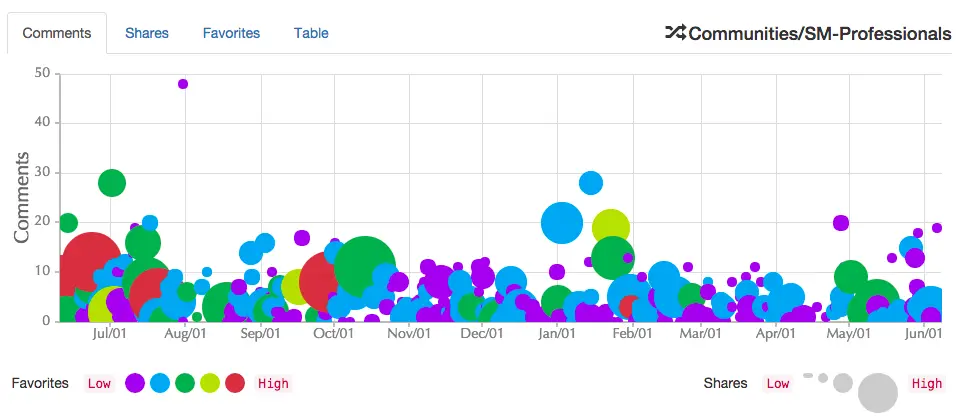
Performed with Competitive Posts Diagnostic report
And by looking at SM’s posts graph, you can clearly see a strange pattern:
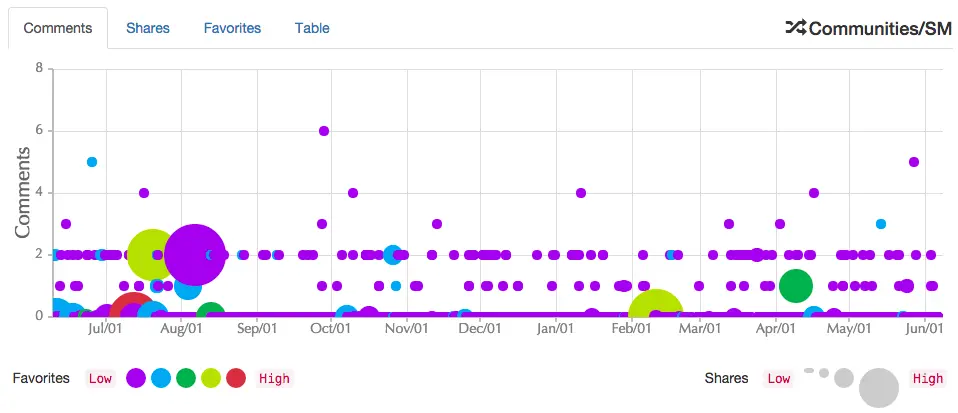
Performed with Competitive Posts Diagnostic report
Most of the posts are low performers with just 1 or 2 comments, or mostly with no comments at all. The same goes for Favorites (+1s) and Shares. But I’m stressing the attention on Comments mainly because it’s the activity communities build on - no conversation, no community. And it looks like this cornerstone metric is suffering at the SM community.
Let’s take a look now at the % of dead posts for our community compared to other communities:
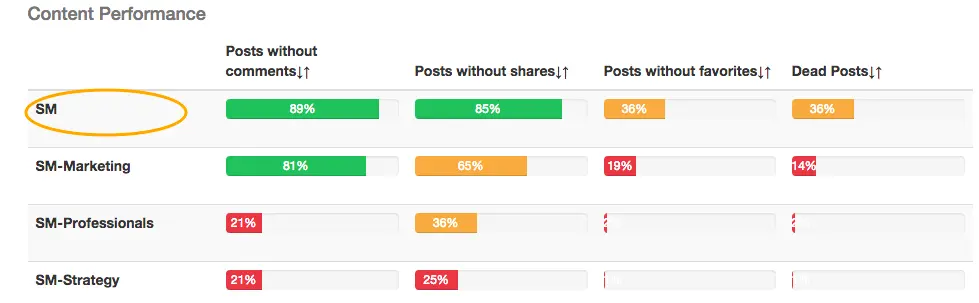
Performed with Content Performance report
SM community is a leader by the % of “dead posts”. 36% of posts without any activity at all, and a frightening 89% have no comments and 85% - no shares. This could be a very troubling sign. If we take into account the really high number of posts compared to the low number of followers, it can partly explain the low activity and high number of ignored posts. Followers simply don’t have enough time to respond to all the posts.
And a quick look at the community's feed shows that the overwhelming majority of the posts are made by the community owner. So our first assumption was correct - the huge number of posts are explained by the artificially generated activity by the owner. It’s hard work keeping a community active and alive. And a relatively small members base may slow down the natural growth of the group, so to keep it up and running, an owner would have to post the majority of the content himself/herself. But when, despite such efforts, the discussion between members isn’t happening (the number of comments is low) and keeps decreasing over time it may a be a warning sign.
Takeaways:
-
When evaluating a community don't just look at the bare Number of Followers, go deeper by analyzing the Posting Density, Engagement Level and Content Health to see the whole picture.
-
Numbers in a vacuum don't mean anything without context - compare the metrics to historical trends or competitors' results to see if something clearly stands out.
-
Conversations are the fuel of the community - evaluate the Conversation rate and how it changes over time to see if the community is active and produces useful content for its members.
-
And don't forget to check the level of ignored posts compared to the competition to spot any unhealthy patterns.
When you’re ready to rock your social media analytics
give TrueSocialMetrics a try!
Start Trial
No credit card required.
Continue reading
AB Testing with Google Analytics and Event Tracking

Top 5 American Pizza Brands in Social Media

Movies on Facebook: Creative Ways to Promote DVD Releases

How Often Top Brands Tweet
